<?xml version="1.0" encoding="utf-8"?><feed xmlns="http://www.w3.org/2005/Atom" ><generator uri="https://jekyllrb.com/" version="4.3.2">Jekyll</generator><link href="http://localhost:4000/atom.xml" rel="self" type="application/atom+xml" /><link href="http://localhost:4000/" rel="alternate" type="text/html" /><updated>2025-08-24T21:35:47+02:00</updated><id>http://localhost:4000/atom.xml</id><title type="html">Science &amp;amp; technology experiments</title><subtitle>coding, data science, ml, cloud, greentech</subtitle><author><name>Dzidas Martinaitis</name><email>blog@dzidas.com</email></author><entry><title type="html">Lack of operational excellence threatens us, not AI</title><link href="http://localhost:4000/ml/2025/08/24/operational-excellence-vs-ai/" rel="alternate" type="text/html" title="Lack of operational excellence threatens us, not AI" /><published>2025-08-24T00:00:00+02:00</published><updated>2025-08-24T00:00:00+02:00</updated><id>http://localhost:4000/ml/2025/08/24/operational-excellence-vs-ai</id><content type="html" xml:base="http://localhost:4000/ml/2025/08/24/operational-excellence-vs-ai/"><![CDATA[<p>Can we talk about AI without talking about AI? Here we go. While traversing Germany, I booked a hotel for the night which fitted my needs: outside a city and, most importantly, self-check-in, as I was planning to stop at midnight, have a rest, and continue. Of course, there was a surprise. At 12:30 a.m., when I was trying to unlock the room with the keyless system, the lock wouldn’t budge. I checked with another guest that my approach was right; the lock was just not reacting. In such a situation, the fallback is to call a support number, wait on the line for 20 minutes, and get the issue resolved. The catch? The support line’s working hours are from 9 a.m. to 6 p.m. And if you have a problem, that’s your choice!</p>

<p>We can disentangle this situation into two - a technical and a business problem. On the technical side, even a junior knows that systems crash, hit a bug, or “misbehave.” Therefore, you must have a workflow for dealing with such situations. If you are running a sensitive, customer-facing system, then you have to have someone on-call for an overnight shift, which is definitely an extra expense. Secondly, you definitely want to capture such events, analyze the cause, potentially interview angry customers, and resolve the issue, which in turn will reduce on-call expenses (here I assume that there are two different rates for active and passive on-call duties). For example, Amazon has a <a href="https://wa.aws.amazon.com/wellarchitected/2020-07-02T19-33-23/wat.concept.coe.en.html" target="_blank">Correction of Error (COE)</a> process, which captures what happened, the impact on customers and/or the business, the root cause, the actions taken, and the lessons learned. Now, if you shut the blinds on your support at 6 p.m. while customers are actively checking in outside your support hours, sure thing — you are saving a lot of cost. And that brings us to the business problem.</p>

<p>Have you tried to book a hotel at 1 a.m.? If I ran a hospitality business, I would expect two types of customers at such hours: a hedonist type, very likely, and someone dumped by another hotel, very unlikely. As a business owner, you might think that you want to strive for a balance between your profit and customer satisfaction, which I now believe leads to mediocrity. You see, you can stomach some negative reviews and pay Booking.com or Google to be less affected by them. However, I really like the idea described in <a href="https://www.amazon.com/You-Are-Badass-Making-Money/dp/0735223130?&amp;linkCode=ll1&amp;tag=quantitativ0e-20&amp;linkId=fa3dd55b0602a5c176db2c80829129f1&amp;language=en_US&amp;ref_=as_li_ss_tl" target="_blank">“Badass: Making Users Awesome”</a> by Kathy Sierra, which says that your business should make the customer awesome or enable them to do epic things. A happy customer will share why they are happy or what makes them awesome, which will lead to a nice growth of your business. And letting a customer sleep under a bridge is actually the opposite.</p>

<p>The biggest marketplace in the world is actually driven by a similar idea — customer obsession. The customer is the center of the business, and everything is made to make it feel like an epic journey: you don’t like the product, we are happy to take it back; was it damaged or too late? No questions asked, we are happy to solve that. You might already be spoiled by their service, but believe me, some marketplaces make it an Everest to resolve any of these issues.</p>

<p>Now, Sam (OpenAI/ChatGPT), Dario (Anthropic/Claude), etc., are selling a fantasy that you can ignore the exact problems described above because an army of agents will take care of it, leaving you to just dream about how to make money and consume more agents. My bet is that if we suck at building businesses involving rule-based systems, we are going to multiply those failures with GenAI. An interesting nugget about the difference is this: in a rule-based system, programmers describe all potential outcomes. Any unwanted behavior is a bug or an exception, making the system’s behavior deterministic. With smart programmers and the right methodology, those errors can potentially be eliminated. But GenAI is a probabilistic model, so by its very definition, it will cause issues in a small number of cases.</p>

<p>I’m not a GenAI denier or an AI doomer, but I want to sell a different view of the near future—let’s say 2-10 years ahead. For the builders who can utilize GenAI tools, incorporate operational excellence practices into the process, and build an epic experience for their customers, this is actually the golden age. Sure, you might not be the subject of a flashy news story, like the ones about interns getting $100M+ offers, but businesses are ready to compensate you dearly for running their business flawlessly.</p>]]></content><author><name>Dzidas Martinaitis</name><email>blog@dzidas.com</email></author><category term="ml" /><summary type="html"><![CDATA[Your business's biggest threat isn't the rise of AI, but the lack of operational excellence, a problem that new technology will only amplify.]]></summary></entry><entry><title type="html">The power of prototyping</title><link href="http://localhost:4000/datascience/2024/12/16/the-power-of-prototyping/" rel="alternate" type="text/html" title="The power of prototyping" /><published>2024-12-16T00:00:00+01:00</published><updated>2024-12-16T00:00:00+01:00</updated><id>http://localhost:4000/datascience/2024/12/16/the-power-of-prototyping</id><content type="html" xml:base="http://localhost:4000/datascience/2024/12/16/the-power-of-prototyping/"><![CDATA[<p>Why would a company or person be interested in creating a prototype? The answer is simple - to test a new idea, improve a product, or find a better or more optimal way to solve a business problem. According to Statista, 56% of organizations worldwide expect generative AI to enhance these aspects, though many likely don’t have an exact plan for implementation. In this blog post I want to share my experience on building prototypes, quickly testing ideas and most importantly, innovating.</p>

<p>You would be right to question my authority about prototypes, as I don’t have a lifetime of experience. However, I spent over two years working for the AWS prototyping team, where I engaged with dozens of companies from various verticals and of different sizes - from startups to regional banks and beyond. So, I have a couple of anecdotes from that experience.</p>

<h3 id="the-good-one">The good one</h3>

<p>One example in particular highlights why it’s important to test and validate ideas. We joined an ongoing customer project with the main goal of onboarding them on AWS ML offerings, especially deep learning. Prior to our engagement, the sales pitched that an ML model could be built and the process automated by eliminating a human in the loop, which was a low-level role for students. The sales play was that $70,000 expenses could be replaced by AI, though AI might have lower accuracy.</p>

<p>We spent some time enabling the team to build the models and use the tools on AWS platform, but you could feel that the customer’s engineering team was getting frustrated - the model was giving us 80% accuracy, meanwhile a student could spot with almost 100% accuracy. I relayed the message to the sales team and management that the customer’s tech team wasn’t really happy just getting educated about cloud and AI capabilities. However, the leadership teams on both sides were very happy about this progress.</p>

<p>Nonetheless, I had a hunch that there might be a simple solution avoiding deep learning altogether, so I scoped some time to sift through research papers for a potential solution. A few days later, my colleague happily pinged me back saying that he found a solution - 3 lines of code based on <a href="https://opencv.org/">opencv</a> library. The most important thing was that we were able to deploy our code into a serverless function (AWS Lambda) and avoid expensive compute instances used for deep learning, spending only $3 vs. the original $70,000.</p>

<p>Was the customer happy - very! Was the sales team happy? Hell, no! What’s great about Amazon is that everything revolves around customer obsession, and the long-term game is that by saving money there, we returned this budget back to the customer for other experiments and expansion. A takeaway from this experience is that without extra effort and experimentation, the customer would keep spending $70K on what could be automated with a library from 1999.</p>

<h3 id="prototyping-today">Prototyping today</h3>

<p>I agree with <a href="https://en.wikipedia.org/wiki/Andrew_Ng">Andrew Ng</a>, who was a keynote speaker at an internal ML/AI conference: nowadays, it’s very cheap and quick to validate an idea. What he meant is that with advancements in AI and ML, we can build a prototype in a week or even a day, which is an amazing thing. Now the catch is that other parts of the project might still be lagging.</p>

<p><img src="/images/innovation_timeline.webp" alt="Prototyping takes much less time than it used to" /></p>

<p>I wrote <a href="https://dzidas.com/ml/2024/10/22/implementing-data-science-projects/">a blog post</a> where I shared my mental model of running data science projects and implicitly mentioned that preparation and scoping will take most of your time in a project. GenAI might help you with writing a scoping doc or a proposal, but the savings won’t be significant. Meanwhile, the Prototyping stage not only can be reduced significantly, but you can try 10x-100x more ideas and choose the best one from an enormous pool of good ones.</p>

<p>To contrast possibilities today with those from a few years back, here is a relevant example. I had a prototyping engagement with a customer who needed to extract and structure data from reports of different companies. After four weeks of heavy development with cloud tools such as AWS Extract, which supposedly helps to extract entities and specific keywords like profit or expenses, we concluded that the approach was still too fragile to be automated and the added value was not significant.</p>

<p>Nowadays, with the help of LLMs, unstructured data has a higher chance of being structured, and additional insights can be extracted more easily. The lesson to take away is that not every prototype will end with business growth, and stakeholders need to be prepared for that. It’s a risky investment decision - you pull a team or more for a week, burn some IT resources, which can sum up to $10K-$50K a week or more. And your probability of success should be below 100%; otherwise, why prototype?</p>

<p>The cost of not doing it might be much greater, but this might not be in sight of the management or decision-makers. For example, in this case, the company needed to test new grounds because the speed at which they were parsing documents was core to their business.</p>

<h3 id="constant-push-for-innovation">Constant push for innovation</h3>

<p>Let’s zoom out from prototyping - it is just a small piece in the grand scheme of innovations. How do you make sure that you, your team or the company with which you are engaging is constantly innovating?</p>

<p>For innovations at Amazon, I would emphasize two high-impact factors: an influx of new people and the Working Backwards innovation framework. For the former, a person without historical baggage would be keen to try the same idea which may have failed 10 times already, simply because they don’t know its history. Meanwhile, due to the rapid pace of technological advancement, the timing now might be right for success.</p>

<p>I recall a colleague suggesting setting up a phone line with a voice message box for internal usage, where an issue would be dictated to a machine, analyzed and dispatched to the right person for resolution. Back in 2018, every step of this idea, such as setting up an international line, converting voice to text, or classifying the message, was either a complete blocker (e.g., a person’s accent in a voice message) or months of work (e.g., text classification with NLP tools). If someone is assigned a similar task today, it would be a walk in the park - LLMs to the rescue!</p>

<p>The lesson here is to be conscious of your biases, try to break out of your bubble, and review previous failures; maybe now is the right opportunity.</p>

<p>Now, there are many frameworks to help with innovations and creation of new products. What’s special about the Working Backwards and PR/FAQ framework is that it’s customer-centric, pushing you to think about the customer rather than the product. Basically, you start with:</p>

<ul>
  <li>Listen and understand the customer’s perspective. We are interested here in pain points, challenges, desires, etc.</li>
  <li>Define stage. The inputs from the previous stage translate into a clear problem or an opportunity - our North Star that will guide us through the project.</li>
  <li>Invent stage. Here we look for the best solutions given a problem, dream big, and involve others in the development process.</li>
  <li>Refine. At this stage, we want to be crystal clear about how the idea works. Here’s an interesting part: we write a mock press release, not for customers, but to peek into the future when the product is developed. This helps clarify how customers will experience the product and allows for internal communication and discussion. For this purpose, the main document should not be longer than one page, but the appendix will have an FAQ section, which is why it’s called PR/FAQ.</li>
  <li>And finally, we want to test with some experiments, identify the issues, and continuously iterate.</li>
</ul>

<h3 id="connecting-the-dots">Connecting the dots</h3>

<p>Now that we’ve discussed prototyping and innovation, how are these applied in practice? Let me share an example. A finance industry customer was interested in pushing the boundaries with innovations, so we allocated a couple of days for business and tech teams to learn about the innovation framework and think big. As a result, we scoped one big, challenging idea for a prototype. A prototype was needed because the idea was ambiguous, with some known unknowns and many unknown unknowns. For example, during the prototype development, we learned that the data possessed by the company was insufficient as counterfactuals were missing, i.e., what would be the outcome if the world were slightly different.</p>

<p>As planned, we built data pipelines, created a user interface, identified challenging or missing parts, and presented a minimally viable product. Through this exercise, we found the project was far from a positive outcome, which was totally fine as we learned about the gaps and a potential path forward. But a big surprise to me was when the business side took that outcome and broadcasted it as a big win with an international press release about cooperation and pushed boundaries. The lesson here is that there are always different points of view, and one should be ready to accept that.</p>

<h3 id="the-difference">The difference</h3>

<p>For data science projects, you might wonder which approach is better - prototyping or the scientific approach? The former came from product design and engineering fields and is driven by agile methodology and rapid development. The latter requires rigorous methodology based on statistical principles, peer review, hypothesis testing, and reproducible results. In my experience, the choice depends on the team and organization you’re working for. The scientific approach is less common in business environments when it’s not a requirement (unlike in the pharmaceutical industry, for example).</p>

<h3 id="final-word">Final word</h3>

<p>Probably everyone agrees that innovations are a must for a company’s or country’s survival. However, there is an edge case where this is not true - there are companies, and I wouldn’t say more than a dozen, where their strategy is to “keep the lights on” or basically extract profits. We know that there are different stages in a company’s lifecycle, and if a company has entered this particular stage, you’re unlikely to succeed with innovations there. The reasons for a company to be in this stage might be many - investors interested in value extraction rather than growth, lack of ownership from the owners, lack of investment, etc. Regardless of the reasons, if the leadership is not interested in innovations, pursuing them has a lower, if any, probability of success.</p>

<p>Good luck with prototyping and innovations! And if you’re interested in discussing this in more detail or running an innovation project, <a href="mailto:blog@dzidas.com">let’s connect</a>.</p>]]></content><author><name>Dzidas Martinaitis</name><email>blog@dzidas.com</email></author><category term="datascience" /><summary type="html"><![CDATA[Learn practical strategies for innovation, prototyping, and creating data-driven products from AWS experience. Explore the Working Backwards framework and real-world examples of successful prototyping.]]></summary></entry><entry><title type="html">Expected returns under a Republican president</title><link href="http://localhost:4000/datascience/2024/12/05/republican-presidents-stock-market-returns/" rel="alternate" type="text/html" title="Expected returns under a Republican president" /><published>2024-12-05T00:00:00+01:00</published><updated>2024-12-05T00:00:00+01:00</updated><id>http://localhost:4000/datascience/2024/12/05/republican-presidents-stock-market-returns</id><content type="html" xml:base="http://localhost:4000/datascience/2024/12/05/republican-presidents-stock-market-returns/"><![CDATA[<p><img src="/images/presidents.webp" alt="4 years S&amp;P500 returns during presidencial terms" /></p>

<p>In this post I want to test an internet myth, that under a Republican president the stock market underperforms and the returns are negative. It felt like a nonsense, but I had to validate it myself. Turns out, it is… nonsense. Since 1969, there have been only 3 presidential terms, all Republicans, which resulted in negative returns over the term. But 5 out of 8 Republican terms ended with positive returns.</p>

<p>You might argue that 4 years is a long period and bearing negative returns might be painful. You might be right, but when should you sell and buy back? As the chart below shows, the stock market under Bush Jr.’s second term was doing great until it tanked at the end in 2008-2009. And it is more of an accident that the recoveries under Nixon and the first term of Bush Jr. started at similar times.</p>

<p><img src="/images/negative_presidents.webp" alt="Negative S&amp;P500 returns during Bush's and Nixon terms" /></p>

<p>Let’s test another hypothesis - maybe a president needs time to change the course of the economy and it takes a while to kick in? How would the results look if we delay each investment period by 6 months? As per the chart below, we have some changes for each term, but the overall picture doesn’t change - a Republican president doesn’t imply a negative return.</p>

<p><img src="/images/presidents_lagged.webp" alt="4 years S&amp;P500 returns during presidencial terms, lagged 6 months" /></p>

<p>I’m surprised by how much growth we observe during any term, but it makes sense as it spans four years. Meanwhile, due to active economic crisis management by the FED, the span of a bear market has shortened to a year or two. So, maybe instead of looking at who was the president, we should be looking at who was the chairman of the FED.</p>

<h3 id="the-fed">The FED</h3>

<p>The Federal Reserve System (FED) was established in 1913 with responsibilities to implement and execute monetary policy, supervise and regulate banks and maintain financial system stability. Interestingly, until the 2008 crisis and FED Chairman Bernanke, its primary levers to influence markets were interest rates, open market operations, and forward guidance. During that crisis, a new approach was added - Quantitative Easing (QE), which mainly included large-scale asset purchases and liquidity injection into the financial system. While the FED had engaged in large-scale asset purchases before, QE was an exception due to its scale. Fun fact, it’s the FED who can increase the amount of money circulating in the system - or put it differently, print money.</p>

<p>In a comparison, a president has tools to influence short-term economic growth, like import tariffs, negotiating trade deals, using executive orders, etc. But the president’s main responsibility is the long-term impact on the economy. Most importantly, for this post, the president nominates the FED chair, but past chairs have managed to resist demands from presidents due to the FED’s high independence. There’ve been cases where the same chairman, nominated by one president, was kept by another, regardless of political party affiliation. For example, the current chairman Jerome Powell was originally nominated by Obama as a FED governor, picked as chair by Trump, and then kept on by Biden.</p>

<p><img src="/images/fed_chairs.webp" alt="S&amp;P500 returns under different FED chairpersons" /></p>

<p>The FED chairpersons’ terms do not exactly match presidential terms, resulting in different returns compared to those of the presidents. Nevertheless, the picture is clear - since 1970, only 3 terms resulted in negative returns despite very different economic challenges and unique management styles of the chairpersons. For example, chairman A. Burns dealt with the OPEC embargo in 1973-74, which led to double-digit inflation. A. Greenspan faced the dot-com bubble burst and 9/11 terrorist attacks, while B. Bernanke was tested by the subprime mortgage crisis. To summarize, the economy and stock returns are influenced by multiple forces, and just having a Democratic president is not enough to make the road less bumpy.</p>

<p>This post is not advice to buy or sell financial assets, just an analysis of historical data. To complicate the question even further, ask yourself: what would be an alternative to your investment during a Republican term?</p>]]></content><author><name>Dzidas Martinaitis</name><email>blog@dzidas.com</email></author><category term="datascience" /><summary type="html"><![CDATA[There's a myth that the stock market underperforms under Republican presidents. Does data support this claim? We analyze S&P 500 returns to test this popular belief.]]></summary></entry><entry><title type="html">How to run data science projects</title><link href="http://localhost:4000/ml/2024/10/22/implementing-data-science-projects/" rel="alternate" type="text/html" title="How to run data science projects" /><published>2024-10-22T00:00:00+02:00</published><updated>2024-10-22T00:00:00+02:00</updated><id>http://localhost:4000/ml/2024/10/22/implementing-data-science-projects</id><content type="html" xml:base="http://localhost:4000/ml/2024/10/22/implementing-data-science-projects/"><![CDATA[<p>In this article, I will outline my mental model for running a science project. Specifically, I’m referring to data or applied science projects, drawing from my experience of over 9 years at AWS and Amazon. You might argue that in agile environments like startups or smaller companies, the approach could differ, but aside from an additional layer of hierarchy, I don’t anticipate significant deviations.</p>

<p>The most crucial question to ask at the start of a project is whether the business problem is well-defined. A well-defined problem could be something like: what is the impact of a sales promotion? Or, what is the value of adding a new feature? However, as a scientist, you’re more likely to encounter vague business problems — if any are presented at all. For instance, you might be introduced to a business organisation and asked to figure out how you can make an impact on profitability.</p>

<p>Early in my career at AWS, I was introduced to a sales leader who wanted help with data science. We had a few meetings where I tried to identify the business problems they aimed to solve. To my surprise, they didn’t have any clear issues in mind and simply hoped I would work some “magic.” In hindsight, I should have proposed concrete projects focused on improving profitability, rather than an optimization project. It took me a few years to realize that a rapidly growing sales organization is primarily concerned with increasing profit by selling more, not through optimization efforts like churn analysis.</p>

<p>To avoid similar challenges, I developed the chart below, which outlines four key areas involved in running a science project. The red section represents the stakeholders and sponsors, the blue section covers scoping, the green defines the metrics and the definition of success, and the yellow focuses on what’s needed to implement and execute the project. Some might argue that only the right side of the diagram, particularly the yellow box, defines a science project, but in my experience, that’s usually the “easy” part.</p>

<p><img src="/images/science_flow.webp" alt="A flow diagram for a science based project" /></p>

<h3 id="stakeholders">Stakeholders</h3>

<p>It’s quite rare for business leaders to present a clear business problem or a well-defined question. In large organizations like Amazon, the left side, comprising the red and blue squares, tends to be where senior or principal roles are deployed, as many problems are vague or poorly defined. You might argue that handling stakeholders and scoping projects are responsibilities typically assigned to managers or product managers. However, in my experience, individual contributors in tech roles are often heavily involved or expected to take the lead, particularly in FAANG - type companies.</p>

<p>When identifying stakeholders, I usually start from the ground up—finding a team that needs a solution, building a plan, and scaling from there. The top-down approach may target higher impact but often has a much higher failure rate due to added layers of hierarchy and tends to result in multi-year projects.</p>

<h3 id="scoping-a-project">Scoping a project</h3>

<p>Once stakeholders are identified, the next step is to assess the potential impact of the project. You want to avoid working on projects with a lower ROI than the value you bring. Additionally, this helps you prioritize projects if you’re choosing between several. One critical question during scoping is whether there are already deployed solutions or ones that can be acquired. This can be tricky, as you might receive biased responses claiming no solution exists or that it’s inadequate. A shiny new project is always more appealing to those involved, but repurposing or improving an existing solution can lead to significant cost savings and knowledge transfer.</p>

<p>When it comes to project sponsorship, the discussion can quickly turn sour. However, for a project to continue successfully, you need to ensure that your stakeholders, or “customers,” are truly willing to invest. Don’t assume that the only cost is your time—it’s a multi-layered issue. Can you access the necessary data, or do you need support from a partner team? What does the testing phase entail, and do you have the resources allocated for it? If the project succeeds, what will the continuation look like? Do you have the means to take it to production and maintain it? In my experience, the latter is often overlooked until it becomes a significant problem.</p>

<p>One of the common pitfalls in data science projects is aligning on the results. By this, I mean that stakeholders are eager to use the project’s output to validate their assumptions—if the results align with their needs. However, when the results conflict with their expectations, the adoption of those findings can be quickly “killed.” For example, we once developed a methodology to assess the impact of specific business actions. The quantitative approach revealed that not every action aligned with qualitative measurements, which are often prone to misinterpretation. As a result, we faced significant resistance when attempting to scale the project across the organization.</p>

<h3 id="metrics-and-definition-of-success">Metrics and definition of success</h3>

<p>At this stage, your project is well-defined and outlined on a paper. You can begin assembling a team to execute it, but before diving in, you need to define what the success will look like. By that I mean, that you need to look in the future and estimate how a good outcome looks like. E.g. you might decide that your model will be 10% above a baseline or your new method will be able to estimate a causal effect of a specific action. The clear definition is like the North Star which will lead you to the goal.</p>

<p>Next, the metrics and a plan for the experimentation phase. This means establishing a baseline for your model and planning how the experimentation will be conducted. You should determine the methods you’ll use to test your model (e.g., A/B testing for online models) and set clear expectations for the impact you hope to achieve. It’s crucial that your stakeholders are heavily involved at this point, and they must commit resources to support the process. In most cases, this means getting their agreement on the exact steps that will be taken.</p>

<p>For example, I once built a highly promising model, but testing its performance required the involvement of multiple people. Initially, everyone was motivated to follow the AI-enabled recommendations, but after some time, they reverted to their usual routines. It took significant resources to get the project back on track. In hindsight, I should have had clear metrics in place and handed over the responsibility for test implementation to the business unit manager.</p>

<h3 id="execution">Execution</h3>

<p>As I mentioned earlier, this part of the project is the easiest in terms of delivery. While you may encounter difficult scientific problems to solve, the three pillars discussed previously (stakeholders, scoping, and experimentation) provide a stable foundation for successful execution.</p>

<p>I purposely left the boxes in the lower right square unconnected because execution can happen either sequentially or in parallel. You might want to ensure the project has solid scientific grounds before progressing, or you might prioritize checking data availability and quality upfront. Flexibility here allows you to adapt the execution based on the nature of the project.</p>

<p>For tracking the project’s progress, weekly or biweekly check-ins work well, especially when the milestones are clear. Usually, the first iteration results in a quick prototype, which helps to realign with stakeholders before diving deeper into the work. This way, you stay on track with the project’s goals and can adjust as needed without wasting time or resources.</p>

<p>To wrap things up, I realize my mental model for running science projects is shaped by my own experiences, and it might not apply to every situation. I’m open to hearing different perspectives and learning about other approaches. If you have ideas or suggestions you’d like to share, feel free to reach out to me at <a href="mailto:blog@dzidas.com">blog@dzidas.com</a>.</p>]]></content><author><name>Dzidas Martinaitis</name><email>blog@dzidas.com</email></author><category term="ml" /><summary type="html"><![CDATA[The article describes a framework on how to run and implement a data science project]]></summary></entry><entry><title type="html">Why are sellers leaving profit on the table?</title><link href="http://localhost:4000/ml/2024/09/03/money_on_a_table/" rel="alternate" type="text/html" title="Why are sellers leaving profit on the table?" /><published>2024-09-03T00:00:00+02:00</published><updated>2024-09-03T00:00:00+02:00</updated><id>http://localhost:4000/ml/2024/09/03/money_on_a_table</id><content type="html" xml:base="http://localhost:4000/ml/2024/09/03/money_on_a_table/"><![CDATA[<p><img src="/images/money_on_table.webp" alt="Sellers left bags of money on a table" /></p>

<p>In the last decade or so, the online retail business has become completely liberated - anyone with a product idea can start selling with minimal investment. Typically, the process unfolds as follows: source an idea, which might be an improvement on an existing product or a copycat of a bestselling item from other marketplaces such as Temu or Alibaba, then purchase or manufacture in China and ship it to a local warehouse. With the rise of smart manufacturing, local production of some products has become more cost-effective, and there are instances where sellers prefer labels that reference local origins. However, despite these developments, China continues to be a dominant global manufacturing hub.</p>

<p>With the product in hand, a seller embarks on the challenging journey of product promotion. To accelerate sales, a seller allocates a budget for promoting the product directly on a marketplace or uses Google and/or social platforms to drive customers to their page and make sales. This creates a major objective: reducing the cost of acquiring a new customer while maintaining or increasing sales volume. When speaking to sellers, this strategy is often reiterated like a mantra. However, other options exist, which could lead to higher profit margins, though they may not be immediately apparent to sellers.</p>

<h3 id="test-everything">Test everything</h3>

<p>Experimentation has always been integral to the marketing and sales process. However, in the pre-ecommerce era, changes in packaging, branding, or products took much longer compared to the present, where everything happens in the blink of an eye. Despite this speed, sellers, particularly those with a few successful products, often show resistance to change, whether in pricing or the context of a product. The reasoning is straightforward: if it sells, don’t fix it. Nevertheless, A/B testing, as simple as changing a product background color or text font, offers the opportunity to experiment on a small scale, thereby minimizing the risk of disrupting overall sales while potentially enhancing them. Such tests can be conducted with 1-10% of customers, and if a change results in lower conversion or margin, the situation can be swiftly reverted. Implementing A/B testing is not overly complex. For example, you can create a page nearly identical to the main product page, alter a few details, and direct every tenth customer there. The critical aspect is to gather sufficient evidence that the change leads to a positive impact, e.g. a better conversion rate or higher sales.</p>

<p><img src="/images/multi_arm_bandit.webp" alt="Multi-arm bandit is ready for an action" class="align-left" />
For those looking to elevate their experimentation efforts, the Multi-Arm Bandit method is worth considering. Unlike A/B testing, where routing allocations are fixed until enough data is collected to make a decision, the Multi-Arm Bandit method dynamically allocates traffic based on the most recent performance. It occasionally makes random selections to continue exploring the ever-changing environment. Furthermore, it offers a more efficient approach for exploring multiple options beyond just A and B. Implementing this method may require assistance, but it is particularly valuable in dynamic environments where opportunity cost is a crucial factor.</p>

<h3 id="price-discovery">Price discovery</h3>

<p>The methods outlined earlier are important for experimentation, but they don’t specify the optimal price for conducting such experiments. In most of the cases, we want to optimise our sales strategy for one of three criterias - profit, revenue or market share.</p>

<p>In scenarios where you have historical sales data across at least two different price points, you are well-positioned to estimate demand elasticities. This concept, developed in the late 19th century, is based on a straightforward principle: when the price rises, the volume of sales falls for almost any good, but it falls more for some than for others. Conversely, reducing prices often leads to an increase in sales volumes. Thus, by observing how changes in price affect sales volumes, you can begin to understand the price elasticity of demand for your product.</p>

<p>The chart below illustrates how we can estimate price elasticity using five data points of price and sales volume. A simple formula allows us to estimate demand at different price points.</p>

<p><img src="/images/elasticity.webp" alt="An example of price elasticity of demand" /></p>

<p>From the example above, let’s take a price decrease from 18.43 to 15.20 where quantities were respectfully 88 and 95. Now we can estimate elasticities:</p>

\[Demand = \frac{(Quantities_{1} - Quantities_{2}) / Quantities_{1}}{(Price_{1} - Price_{2})/Price_{1}} = \frac{(88 - 95)/88}{(18.43 - 15.20)/18.43} = -0.45\]

<p>The demand elasticity number is always negative as it reflects the inverse relationship between price and quantity demanded—when the price of a product increases, the quantity demanded typically decreases, and vice versa. In our scenario, the product demand is inelastic—lowering the price by 1% would increase sales by only 0.45%, while raising the price by 1% would decrease sales by the same amount. Therefore, the optimal choice is to maintain higher price levels.</p>

<p>In general, inelastic demand, where the price elasticity is above -1, indicates that customers won’t significantly change their demand if prices increase. For example, necessities like food, water, and electricity are required regardless of price. Similarly, products with addictive components, such as tobacco and alcohol, tend to have inelastic demand. Another case is brand loyalty, with Apple being a perfect example—their products exhibit highly inelastic demand, allowing prices to increase without losing their customer base.</p>

<p>On the contrary, if a price elasticity is -2 or lower, a different approach is needed. In this case, lowering the price will lead to more sales; however, there is a risk that the customer base might quickly shift to a competitor if their price is lower.</p>

<p>So far, we have only considered two price points for a single product, allowing you to estimate demand elasticities with nothing more than a napkin. When dealing with a dozen products and multiple data points, Excel or Python/R/data science tools will prove invaluable. However, scaling up to a larger product portfolio will require a development of a custom model, which offers additional advantages. Firstly, it allows us to factor in the seasonal fluctuations of a product, such as a sales spike in December or slow summer months. Moreover, it enables us to estimate demand elasticities at a higher level, for instance, by product category. The benefit here is that we can apply the elasticities derived from a category to new products within that category. For example, if you have a new herbal tea product, the elasticities of the tea category can be utilized for this new offering.</p>

<h3 id="examples-of-application-of-price-elasticities">Examples of application of price elasticities</h3>

<ul>
  <li><strong>Promotions</strong>: Businesses often launch promotions to increase market share, enhance product recognition, or boost sales volume. A key question in such scenarios is: How substantial should the discount be? What is the expected sales volume at the new price point?</li>
  <li><strong>Inventory Clearance</strong>: Similarly, a campaign may be initiated to accelerate sales for the purpose of freeing up storage space. In this context, determining the optimal price is crucial. What price should be set to achieve the desired results quickly and efficiently?</li>
  <li><strong>Stock Depletion</strong>: There may be instances where stock levels drop quickly, posing the risk of running out of inventory. In such situations, increasing prices can help decelerate the sales volume, allowing for time to restock. The important question, however, is by how much to raise the price to decelerate sales without completely eliminating customer demand.</li>
</ul>

<h3 id="optimal-prices-for-a-portfolio-of-products">Optimal prices for a portfolio of products</h3>

<p>Price elasticities allow us to simulate demand for each product at various price points, enabling the development of a pricing strategy that optimizes for profit, revenue, or both across our entire product portfolio. This approach can also be applied to optimize other key metrics, such as market share or any other objective.</p>

<table>
  <thead>
    <tr>
      <th>Price</th>
      <th>Sales</th>
      <th>Revenue</th>
      <th>Profit</th>
    </tr>
  </thead>
  <tbody>
    <tr>
      <td>14</td>
      <td>106</td>
      <td>1479</td>
      <td>140</td>
    </tr>
    <tr>
      <td>15</td>
      <td>101</td>
      <td>1511</td>
      <td>144</td>
    </tr>
    <tr>
      <td>16</td>
      <td>96</td>
      <td>1533</td>
      <td><strong>150</strong></td>
    </tr>
    <tr>
      <td>17</td>
      <td>91</td>
      <td>1545</td>
      <td>145</td>
    </tr>
    <tr>
      <td>18</td>
      <td>87</td>
      <td><strong>1566</strong></td>
      <td>130</td>
    </tr>
    <tr>
      <td>19</td>
      <td>79</td>
      <td>1501</td>
      <td>125</td>
    </tr>
    <tr>
      <td>20</td>
      <td>77</td>
      <td>1543</td>
      <td>120</td>
    </tr>
  </tbody>
</table>

<p>The fictitious example above illustrates profit and revenue levels at various price points for a single product. By applying this approach across all products, we can construct the following graph:</p>

<p><img src="/images/optimal_profit.webp" alt="Optimal pricing for your product portfolio" /></p>

<p>In this example, the maximum profit is $30M. If maximizing profit is our sole objective, we can work backwards to extract the optimal price for each product and implement this pricing strategy. However, if increasing revenue is also a priority, you can move along the curve to the right, allowing for higher revenue with only a minimal sacrifice in profit. For example, at $40M in revenue, your profit will be $2.5M lower than at the $35M revenue point, where profit peaks at $30M. In this case, you would be gaining additional $5M in revenue.</p>

<h3 id="challenges-of-applying-price-optimization-techniques">Challenges of applying price optimization techniques</h3>

<p>When building a portfolio with optimized prices, we often assume that we can set the price independently of the market. However, this is not always the case. One challenge is competition. If you’re selling an identical or very similar product as a competitor, customers will likely prioritize the lowest price if all else is equal (such as quality, delivery speed, and brand reputation). In such a scenario, lowering your price might help you outcompete the rival if the product has high elasticity (elasticity less than -1). However, raising the price can give your competitor an advantage, allowing them to capture more sales. Similarly, for inelastic products, it can be difficult to increase prices in a competitive market without losing customers to competitors.</p>

<p>So far, we’ve assumed a linear relationship between price and demand. While a log-log model can better capture this relationship, experience shows that deep discounts (e.g., more than 20% off) can attract a significant increase in customers, deviating from the expected demand curve. As a result, price elasticity estimates are more reliable near current price points, but uncertainty increases as prices move further away from these points. This doesn’t entirely invalidate the use of price elasticities, but it is an important consideration to keep in mind.</p>

<p>Finally, if you have limited data points or only a few products, relying on price elasticities and optimization might be premature. In such cases, consensus decisions, such as experimenting with different prices, can provide the data needed to apply the techniques discussed above effectively.</p>

<h3 id="whats-next">What’s next?</h3>

<p>In this blog post, I intentionally focused less on the modeling and implementation aspects to introduce the topic more broadly. If you find price optimization intriguing and want to explore it further, I highly recommend the following book:</p>

<p><img src="/images/price_opt.webp" alt="" class="align-left" /> <a target="_blank" href="https://www.amazon.com/Pricing-Revenue-Optimization-Robert-Phillips/dp/1503610004?crid=2680LSPOM5N66&amp;dib=eyJ2IjoiMSJ9.HQhjU-2rUpa_1Z6zKvlXNf-La03mAG95L_luWlQQiGCdVWTsobWsEa2NTRNZR9_LXPPNtyXG2rgDZ26nMkK6yEkxKRofU0os-Mw8b-U6Fi5XYQ-93O-V_quXIFiSUT_q6kS5cV2V8CfLDKGayr56RF2s-xUbUokQmYO_TXho2LmHJTkexudwusKrbqFGeowo0190hrBorX-qd3uPpi-wVsoKoS20sGXxlUxaMYu8wQc.H4S8o2-H_vvfw8O-WX6ewlVJR4-aQgnMJTTLvnE2yLE&amp;dib_tag=se&amp;keywords=pricing+and+revenue+optimization&amp;qid=1724877272&amp;sprefix=pricing+and+%2Caps%2C207&amp;sr=8-1&amp;linkCode=ll1&amp;tag=quantitativ0e-20&amp;linkId=7132e633241cd9e185d7288ba84cce9c&amp;language=en_US&amp;ref_=as_li_ss_tl">Pricing and Revenue Optimization</a> by Robert L. Phillips</p>]]></content><author><name>Dzidas Martinaitis</name><email>blog@dzidas.com</email></author><category term="ml" /><summary type="html"><![CDATA[How e-commerce sellers, such as Amazon, Shopify, Temu and etc. can optimise the prices and have a higher revenue and profit. Price elasticities and A/B techniques can really make a big impact on your earnings.]]></summary></entry><entry><title type="html">How does a 1% increase in traffic cost your health?</title><link href="http://localhost:4000/ml/2023/12/19/traffic-impact-on-pollution/" rel="alternate" type="text/html" title="How does a 1% increase in traffic cost your health?" /><published>2023-12-19T00:00:00+01:00</published><updated>2023-12-19T00:00:00+01:00</updated><id>http://localhost:4000/ml/2023/12/19/traffic-impact-on-pollution</id><content type="html" xml:base="http://localhost:4000/ml/2023/12/19/traffic-impact-on-pollution/"><![CDATA[<p><img src="/images/co2_girl.webp" alt="A girl suffering from air pollution in Luxembourg" /></p>

<p>A causal analysis ran on the traffic data collected in Luxembourg, a small and green country in Western Europe, indicates that a 1% increase in traffic leads to a 0.45% rise in nitrogen dioxide (NO2), a major air pollutant primarily emitted from cars and factories. Elevated levels of NO2 can adversely affect health in various ways. It can make breathing problems worse, negatively impact heart health, increase susceptibility to infections, and particularly affect vulnerable groups such as individuals with asthma, children, the elderly, and those with existing heart and lung conditions.</p>

<p>In <a href="https://environment.ec.europa.eu/topics/air/air-quality/eu-air-quality-standards_en">the air quality directive</a> the EU has set two limit values for NO2 for the protection of human health: the NO2 hourly mean value may not exceed 200 micrograms per cubic metre (µg/m3) more than 18 times in a year and the NO2 annual mean value may not exceed 40 micrograms per cubic metre (µg/m3).</p>

<p><img src="/images/lux_map.webp" alt="Pollution data from Luxembourg city and Esch sur Alzette" class="align-right" /></p>

<p>
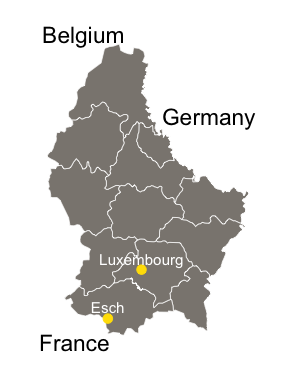
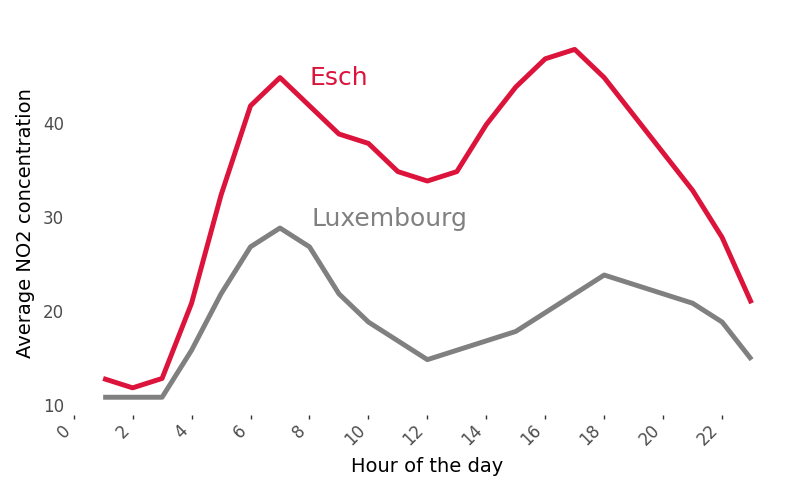
The data for this analysis were collected from two different locations in Luxembourg, each about 30 kilometers apart. In both locations, traffic and air quality sensors were placed in close proximity to provide accurate measurements of traffic-related pollution. Among these, the city of Esch sur Alzette stands out. Despite having similar traffic counts as the other location, Esch sur Alzette consistently shows higher pollution levels. This difference could be attributed to the city’s history of being surrounded by heavy industry. Interestingly, at night, pollution levels between the two locations tend to converge, indicating that the elevated pollution in Esch sur Alzette fluctuates with daily activities and is not a constant feature.</p>

<p><img src="/images/avg_pollution.webp" alt="Average pollution in Luxembourg country" /></p>

<h3 id="recommendations">Recommendations</h3>

<p><img src="/images/esch.webp" alt="Pollution data from Luxembourg city and Esch sur Alzette" class="align-left" /></p>

<p>The results of the causal analysis can be used to precisely control traffic overflow in hotspot areas. They can help calculate a range of traffic values, and upon nearing maximum capacity, traffic can be diverted through alternative routes. In the case of exceeding the maximum allowed CO2 levels, we can calculate how many vehicles need to be diverted from the affected area to normalize the pollution levels.</p>

<p>The quesiton is if it feasible as Luxembourg has already invested in traffic flow optimization - it offers free public transport nationwide, and numerous upgrades have been made to roads and other transportation links. Yet, these improvements do not alleviate the high pollution levels in areas at the crossroads with France. Any enhancements, such as increased highway capacity or better traffic management, are quickly offset by an influx of more vehicles.</p>

<p>For residents in highly polluted areas, the advice might be to relocate. However, these areas are known for their lower real estate prices, making relocation impractical for many.</p>

<p>
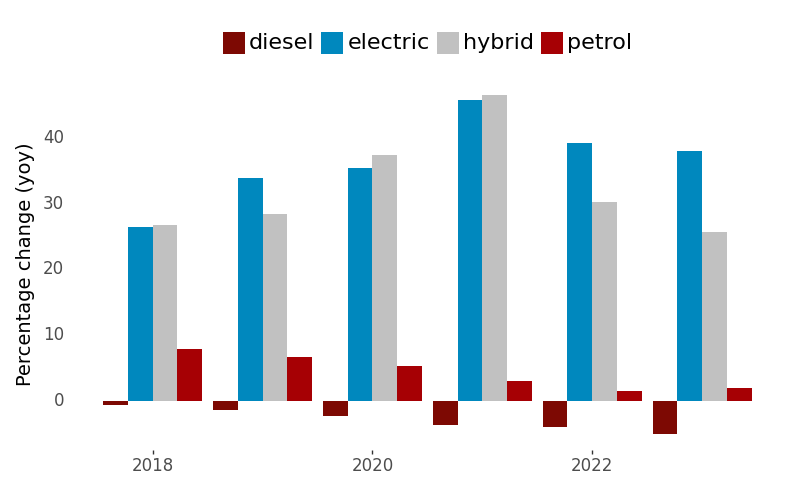
Additionally, a nation goal should be to decrease the number of older-generation cars and ideally replace them with electric vehicles (EVs). The chart below shows that the percentage growth of EVs in Luxembourg is impressive - around 35% for the last 4 years. At the same time, the prevalence of diesel and petrol cars is declining. However, their absolute numbers remain high, with 268000 diesel and 237000 petrol cars. Assuming a consistent growth rate, it will take about 8 years for EVs to reach the current levels of diesel and petrol cars, starting from the current count of 23400 EVs. On a positive note, not all older cars are in active use, despite being registered. Additionally, while newer-generation cars emit fewer pollutants than their older counterparts, they are not entirely NO2 neutral.</p>

<p><img src="/images/ev_growth.webp" alt="Percentage of EV in Luxembourg" /></p>

<h3 id="data">Data</h3>

<p>As mentioned earlier, the data was collected from two different locations where the NO2 sensors and traffic counters were situated approximately 700m-800m apart. Both locations are in proximity to a city. The traffic and pollution data were acquired from <a href="http://data.public.lu/en/datasets/">data.public.lu</a> - a public data repository of the Luxembourg government. The weather data was obtained from a third party, as data.public.lu does not currently provide it, but plans to do so in the second half of 2024. For the analysis, the following filters were applied:</p>
<ul>
  <li>The date range is from 2020-03-01 to 2022-12-31, as earlier data is very sparse and, presumably, unreliable.</li>
  <li>
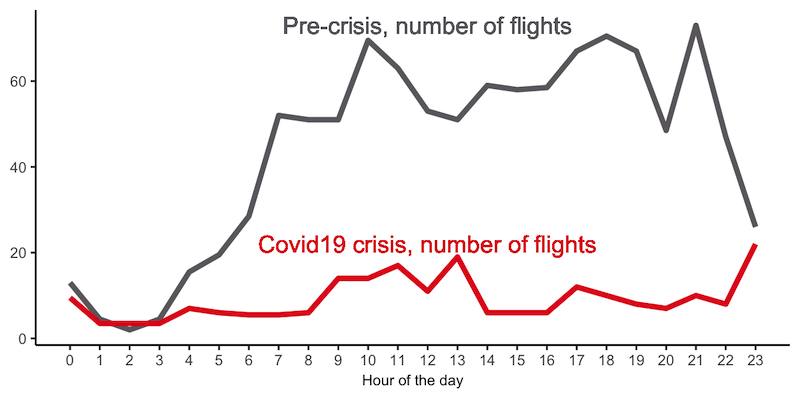
The models are built on rush hour data, spanning from 7:00 to 21:00. Early investigations indicated that the data distributions for night and day are quite different; therefore, they were modeled separately.</li>
</ul>

<h3 id="a-simple-regression-model">A simple regression model</h3>

<p>In this analysis, I explored various methodologies, all tied to a causal question: what is effect on NO2 pollution with a one percent rise in traffic. The need for causal inference comes from the limitations of simple linear regression, which often yields inaccurate or biased results, preventing reliable conclusions from mere traffic and NO2 data correlations. An alternative approach, a controlled experiment involving random assignments of vehicle passage near sensors, while methodologically sound, is impractical to implement.</p>

<p>Let’s begin by considering a simple linear regression model, where we assume that NO2 pollution is solely driven by traffic.</p>

\[log(pollution) = \alpha + \beta * log(traffic) + \varepsilon\]

<p><img src="/images/poll_traffic.webp" alt="Total effect of pollution from traffic" class="align-center" /></p>

<p>
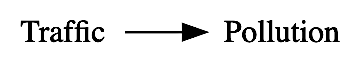
The estimate of \(beta\) or the slope of this model, gives us <code class="language-plaintext highlighter-rouge">0.4898</code> or 0.48% effect and \(R^2\) is <code class="language-plaintext highlighter-rouge">0.1851</code> meaning that only 18.5% variability can be explained with this simple model. But let me remind you, that this approach captures <strong>the total</strong> effect on NO2 and potetially it means that we overlook other potential confounding factors. For those unfamiliar with the term, a confounder is a variable that influences both the outcome (in this instance, pollution) and the independent variable of interest (in our case, traffic).</p>

<p>
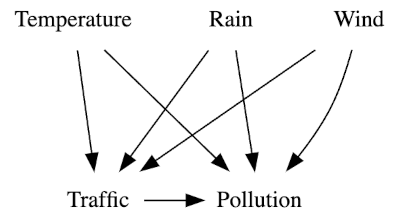
From extensive research on NO2 pollution, we know that major contributors include cars and factories. In my analysis, I have considered the following variables as potential confounders:</p>

<ul>
  <li><strong>Air temperature</strong>: Temperatures below 0°C may lead individuals to turn on heating, some of which might still use coal or other ‘dirty’ materials. This also affects traffic - we can expect more cars during both cold and hot days.</li>
  <li><strong>Wind speed</strong>: High wind can lower NO2 concentration in an area. However, the absence of wind, combined with a sunny summer day, might increase NO2 concentration. Windy days, perceived as unpleasant, might also increase traffic.</li>
  <li><strong>Precipitation</strong>: Rainy days might affect both NO2 concentration and traffic flow.</li>
  <li><strong>City code</strong>: Due to varying landscapes and urban planning, different cities are expected to have distinct effects on traffic and pollution. For example, Luxembourg City has many valleys where pollutants can be trapped.</li>
  <li><strong>Time (omitted from the analysis)</strong>: Initially, including time variables such as hour, workday, month, and year might seem beneficial due to the high seasonality in the dataset. However, the traffic data captures the seasonality very well and time doesn’t have a direct effect on the pollution levels.</li>
</ul>

<h3 id="an-advanced-regression-model">An advanced regression model</h3>

<p>The additional features outlined above allow us to build a causal graph and more precisely estimate the effect of the treatment group, namely the traffic. The estimated effect is <code class="language-plaintext highlighter-rouge">0.4505</code> or 0.45%, which is 0.03% lower than that estimated by the simple model. Meanwhile, \(R^2\) has increased to 0.48, which is a positive development.</p>

<div class="align-center">\[log(pollution) =\]
</div>

<div class="align-center">\[\alpha + \beta_t * log(traffic) + \beta_c * city + \beta_t * temperature + \beta_w * wind + \beta_p * precipitation + \varepsilon\]
</div>

<p><img src="/images/adv_model.webp" alt="Total effect of pollution from traffic" class="align-center" /></p>

<p>
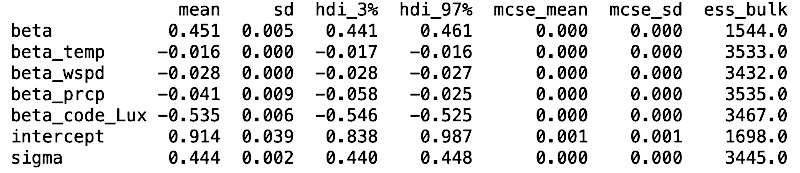
Beyond yielding more accurate estimates, the multiple input model offers detailed insights into each variable. Consider the table presented below:
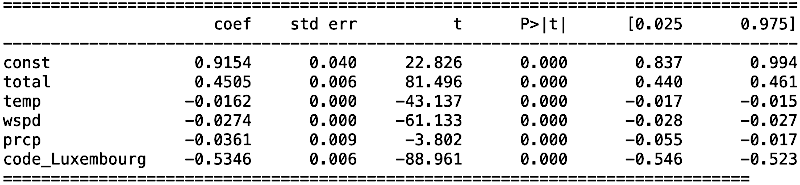
</p>

<p><img src="/images/adv_params.webp" alt="Total effect of pollution from traffic" class="align-center" /></p>

<p>Of particular interest is the <code class="language-plaintext highlighter-rouge">code_Luxembourg</code> variable. This indicates that, on average, the difference in pollution levels between Esch sur Alzette city and Luxembourg is 54%. Essentially, this implies that the model estimates a 54% reduction in pollution levels in Luxembourg compared to Esch sur Alzette, assuming all other variables remain constant. Furthermore, the model shows that an increase in precipitation, wind speed, or temperature leads to a decrease in NO2 pollution by 3.6%, 2.7%, and 1.6%, respectively.</p>

<h3 id="a-double-ml-model">A double ML model</h3>

<p><img src="/images/double_sword.webp" alt="A doubled sword represents DoubleML" class="align-right" /> I have incorporated a DoubleML model into the analysis, recognizing that it may not be a perfect fit for the problem at hand. A key selling point of this approach is its ability to handle high-dimensional data and effectively manage a large number of potential confounders. Supposedly, DoubleML reduces the necessity for deep domain expertise, allowing one to construct models even with a basic understanding of the system and data, provided there is ample data and some familiarity with machine learning techniques. My contention, however, is that constructing a theoretical model is still feasible and beneficial. For instance, in this analysis, we can derive numerous variables from the ‘datetime’ variable, such as year, month, and day of the week. Yet, in constructing a theoretical model, we could simply use a consolidated time variable to gauge its overall impact on the system.</p>

<p>While the DoubleML approach might be excessive for the current problem, its practical implementation reveals several issues. First, the model primarily yields estimates on the interaction between the treatment and the outcome, but it does not inherently provide insights into other parameters like city, temperature, or rainfall. This means additional steps are needed to analyze these factors. Second, the complexity of the DoubleML implementation can obscure the model’s internal workings, leading to a reliance on superficial understanding. Users must trust the model’s outcome without fully grasping the underlying mechanics.</p>

<p>The implementation of a DoubleML model is relatively straightforward. First, you build a model to predict the treatment using the input variables. To capture non-linear relationships, any modeling technique can be employed. In my analysis, I utilized XGBoost. We build the model on a training dataset and then make predictions on the test set. However, our focus is on the residuals, i.e., the difference between the true values of the test set and the predicted values.</p>

<div class="align-center">\[log(traffic) = city + temperature + wind + precipitation\]
</div>

<div class="align-center">\[residuals_{traffic} = Y_{traffic} - \tilde{Y}_{traffic}\]
</div>

<p>Next, we proceed to calculate the residuals of the outcome model, constructed without including the treatment variable.</p>

<div class="align-center">\[log(pollution) = city + temperature + wind + precipitation\]
</div>

<div class="align-center">\[residuals_{pollution} = Y_{pollution} - \tilde{Y}_{pollution}\]
</div>

<p>Finally, we obtain our estimate via a simple linear regression:</p>

<div class="align-center">\[residuals_{pollution} = \alpha + \beta * residuals_{traffic}\]
</div>

<p>The result is <code class="language-plaintext highlighter-rouge">0.44</code> which is close to the estimate of the multiple input regression model at 0.45, however \(R^2\) is lower at 22.5%</p>

<h3 id="bayesian-inference-model">Bayesian inference model</h3>

<p><img src="/images/yin_yang.webp" alt="A doubled sword represents DoubleML" class="align-left" /> To me, Bayesian inference is an ideal complement to Causal Inference. Firstly, there’s a nuanced difference in how Bayesian inference presents estimated parameters compared to frequentist frameworks. Frequentist confidence intervals indicate the range within which we would expect <strong>the true parameter value</strong> to fall in <strong>repeated samples</strong>, not the probability of the parameter being within that range in a given sample. In contrast, Bayesian credible intervals offer a probability-based interpretation: they indicate <strong>the likelihood of the parameter</strong> being within a certain range, given <strong>the observed data and prior</strong> knowledge.</p>

<p>Secondly, we can incorporate existing knowledge about the system under study. In our case, we know the following:</p>

<ul>
  <li>The NO2 pollution rate is always positive.</li>
  <li>A positive relationship exists between traffic count and NO2 pollution.</li>
  <li>Traffic count can’t be negative.</li>
  <li>The log-normal distribution can be used to describe the NO2 pollution rate.</li>
</ul>

<p>The Bayesian model definition almost identical to the multiple input regression model described earlier, except that we need to encode priors which we defined above.</p>

\[log(pollution) \sim Normal(\alpha + \beta_t * traffic + \beta_c * city + \beta_{temp} * temp + \beta_w * wind + \beta_p * prcp)\]

\[\alpha \sim HalfNormal(5)\]

\[\beta_t \sim LogNormal(0, 3)\]

\[\beta_c \sim Normal(0, 2)\]

\[\beta_{temp} \sim Normal(0, 2)\]

\[\beta_w \sim Normal(0, 2)\]

\[\beta_p \sim Normal(0, 2)\]

\[\varepsilon \sim HalfNormal(1)\]

<p>The table below presents the results from the Bayesian inference. The estimated parameters align closely with those obtained from previously described methods. A significant enhancement, however, is the inclusion of credible intervals for each parameter. Specifically, the estimated effect of traffic on NO2 is <code class="language-plaintext highlighter-rouge">0.451</code>, with a credible interval ranging from a lower bound of <code class="language-plaintext highlighter-rouge">0.441</code> to an upper bound of <code class="language-plaintext highlighter-rouge">0.461</code>. This approach, with its emphasis on credible intervals, represents the correct and most informative way to report such results.</p>

<p><img src="/images/bayes_table.webp" alt="The results of Bayesian inference" class="align-center" /></p>

<h3 id="useful-resources">Useful resources</h3>

<ul>
  <li>For those interested in replicating the analysis, which is highly engouraged, or simply exploring the model implementations, I have shared <a href="https://github.com/kafka399/pollution_impact/blob/main/doubleml-modelling.ipynb">my notebook</a> on GitHub.</li>
  <li>A highly recommended resource for understanding Causal and Bayesian Inference is the following book, which I found extremely valuable:</li>
</ul>

<p><a href="https://www.amazon.com/Statistical-Rethinking-Bayesian-Examples-Chapman/dp/036713991X?crid=3TB96CJT5VVDG&amp;keywords=Statistical+Rethinking&amp;qid=1702984593&amp;sprefix=statistical+rethinking%2Caps%2C164&amp;sr=8-1&amp;linkCode=ll1&amp;tag=quantitativ0e-20&amp;linkId=0a63f754a2d656a19df15453cfac0ca8&amp;language=en_US&amp;ref_=as_li_ss_tl"><img src="/images/rethinking.webp" alt="Statistical Rethinking book, highly recommended" class="align-center" /></a></p>

<h3 id="final-remarks">Final remarks!</h3>

<p><img src="/images/vince.webp" alt="The results of Bayesian inference" class="align-center" /></p>]]></content><author><name>Dzidas Martinaitis</name><email>blog@dzidas.com</email></author><category term="ml" /><summary type="html"><![CDATA[The article shares a hands on example on an application of causal inference, double ML and Bayesian inference.]]></summary></entry><entry><title type="html">I got hit by HackerNews - a luck or a skill?</title><link href="http://localhost:4000/cloud/2023/11/01/luck_or_skill/" rel="alternate" type="text/html" title="I got hit by HackerNews - a luck or a skill?" /><published>2023-11-01T00:00:00+01:00</published><updated>2023-11-01T00:00:00+01:00</updated><id>http://localhost:4000/cloud/2023/11/01/luck_or_skill</id><content type="html" xml:base="http://localhost:4000/cloud/2023/11/01/luck_or_skill/"><![CDATA[<p><img src="/images/hn.webp" alt="What happens when your post is top2 on HackerNews" /></p>

<p>This is what happens to your website traffic when <a href="http://dzidas.com/ml/2023/10/15/blind-spot-ds/">your post</a> makes to the front page of tech news aggregators like <a href="https://news.ycombinator.com/item?id=37890685">HackerNews</a> and <a href="https://www.reddit.com/r/datascience/comments/178ifs7/causal_inference_as_a_blind_spot_of_data/">Reddit</a>. It appears that my previous post struck a nerve, sparking extensive discussions on these platforms. In this article, I’ll share my experience, key takeaways, and, most importantly (or perhaps not at all), whether it translated into any financial gains.</p>

<p>Just in case you haven’t come across HackerNews - it’s not a secretive group of hackers. It’s actually a tech news aggregator that’s highly favored by tech enthusiasts. And, as the story often goes, if your content makes it to the front page, be ready for a massive influx of traffic to your website.</p>

<h3 id="luck-versus-skill">Luck versus skill</h3>

<p><img src="/images/luck_skill.webp" alt="Luck versus skill, what is most important?" class="align-left" />
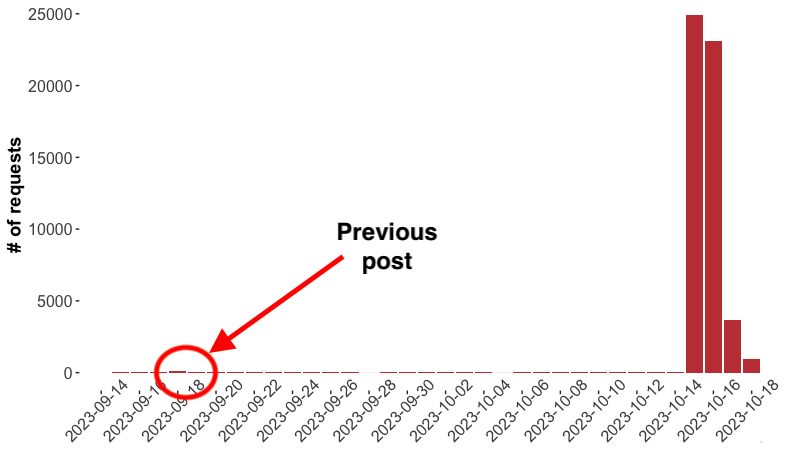
Was it a lucky coincidence that my post went viral? That’s what I thought when I first shared it on HackerNews and suddenly everyone had an opinion in the comments. But then, the same thing happened on Reddit. More discussions, questions, and a bunch of shared experiences. Makes me think it’s more than just luck. I won’t lie; the post took time. It wasn’t just a quick write-up. I spent hours on the text, brainstorming ideas for the images, and doing a bunch of rewrites. Now the big question - can I do it again? I was joking with my friends that you get a credit for one viral post in your life, and if you use it up like I did, the game is over. But the response to the post shifted my thinking. Seems people on the internet still appreciate content that’s thoughtful yet fun, and either teaches you something new or throws in a different viewpoint. But I get it - my single success isn’t much of a voice, but have you heard of Mr. Beast? Believe it or not, I only learned about him recently when I listened to a Lex Fridman’s <a href="https://lexfridman.com/mrbeast/">podcast</a> featuring this viral content creator from YouTube. One key takeaway from that podcast: virality is replicable, but you need to practice the craft and believe yourself.</p>

<h3 id="scalable-blogging-platform">Scalable blogging platform</h3>
<p><img src="/images/hn_top_small.webp" alt="What happens when your post is top2 on HackerNews" />
<em>
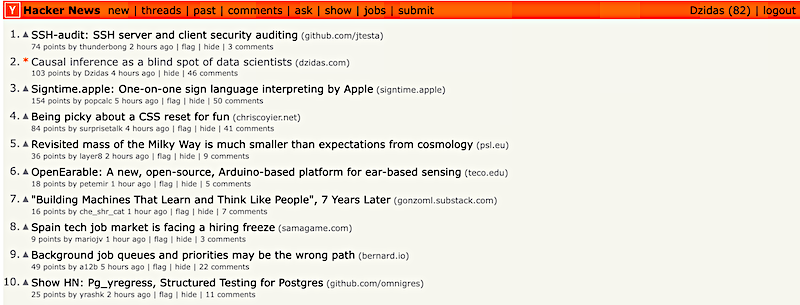
After an hour, the post made to second place</em></p>

<p>The day I shared on HN and Reddit, the average traffic went from 250 requests per day to 25,000 in a single day, excluding bot requests. My website and the infrastructure beneath survived a spike of 100x in traffic as the post remained at the top3 of HackerNews for 12 hours and 24 hours an the front page for.  Now ask yourselves - can your infrastructure cope with 100x increase in traffic and much importantly, what would be the cost?</p>

<p>I’m lucky that, for a personal blog site, I don’t need a fancy platform; therefore, my hosting costs are close to zero. However, my approach might be unconventional. You see - my platform is static, meaning that pages are generated once, when a new post is created. Contrary to my setup, a dynamic content platform such as Wordpress, requires computational power to generate dynamic content with every query. On top of that, I write my posts in a “language” called <a href="https://en.wikipedia.org/wiki/Markdown">Markdown</a>, which gives me flexibility when it comes to formatting, be it code, formula, or just image alignment, and is a simplified version of the HTML language. To convert a post from Markdown to HTML output, I use the <a href="https://jekyllrb.com/">Jekyll</a> tool, which, as far as I know, has only a command-line interface, putting us already into the “hackers” space for the most of the bloggers.</p>

<p>To summarize, this approach yields highly optimized content suitable for hosting, but its steep learning curve and perceived inflexibility might be a blocker for many.</p>

<p><img src="/images/website.webp" alt="A chain to generate and deploy the content of the website" class="align-center" /></p>

<h3 id="serverless-hosting-on-aws">Serverless hosting on AWS</h3>

<p>As my website is just a bunch of HTML files, I upload them to the AWS (Amazon Web Services) platform for storage on the S3 service. This alone enables the running of a serverless website, meaning that there is no cost associated with a continuously operating computer. Additionally, AWS offers an interesting service that distributes your content globally, delivering it to recipients much faster. This becomes crucial when there’s a surge in traffic to your infrastructure — it’s not just a single point serving your content; instead, it is evenly distributed and closer to the user. Does it cost a fortune? Absolutely not—for small-scale websites like mine, AWS provides a free tier, essentially reducing the cost to nothing!</p>

<p><img src="/images/globe_cf.webp" alt="CloudFront serving around the globe" class="align-right" /> While AWS does offer a free tier for its services, it’s essential to note that exceeding these limits will incur costs. I mentioned this earlier, but it’s worth emphasizing. On the second day of publishing the post, a colleague pointed out the potential costs associated with egress traffic on AWS. In simpler terms, egress traffic refers to the data that exits AWS, such as when users access your website or if you’re transferring to a different cloud provider. However, incoming data, known as ingress traffic, doesn’t come with a charge. This feedback prompted me to revisit AWS’s pricing. For the CloudFront service, you receive 1TB free, which is substantial. A rough estimate, considering my post’s size is 3MB and it’s been accessed by 50K users, suggests I’ve only used about 150GB of outgoing traffic. So, I’m well within the free limit.</p>

<p>While it took some pressure off, I felt it necessary to delve further into the AWS billing dashboard and the free tier page. A positive note: the billing dashboard is pretty much real-time, so what you see is likely what you’ll pay at month’s end. However, a hiccup: CloudFront doesn’t appear on the free tier page, and its metrics can only be found on the service page. Moreover, the CloudFront metrics dashboard doesn’t allow you to aggregate data transfer (egress) into a one number, e.g. for a week, but offers finer granularity. To nail down an exact figure, I had to fetch a CSV file and do the math myself. Not really customer obsessed, right?</p>

<p><img src="/images/cloudfront.webp" alt="A complicated way to check CloudFront egress" class="align-center" /></p>

<p>At this point, you might feel overwhelmed by the intricacy of just one service and wonder if there’s a simpler solution out there. Well, there is one – the budget alert. You can set a threshold for a specific amount, and you’ll be alerted when that limit is reached. Can things still go sideways? Of course, especially if you overlook a notification. But it’s definitely better than being in the dark!</p>

<p><img src="/images/bill_alert.webp" alt="AWS billing console and alerts" class="align-center" /></p>

<h3 id="what-went-wrong">What went wrong?</h3>

<p>With the infrastructure holding up well, there was one issue with the post. I use the MathJax library, which allows me to compile text into mathematical formulas, and it usually works very well. However, I have noticed that, randomly, the formulas were not being generated on the page, making it look ugly. It took a lot of effort to debug this issue, and it turned out that the library was declared twice in the code. Fixing a system under heavy load is not fun, but stressful. One learning from this experience is to always test your posts on different browsers.</p>

<p>So, we’ve discussed the technical challenges, but the main question remains unanswered: Is going viral worth it?</p>

<h3 id="benefits-of-a-viral-post">Benefits of a viral post</h3>

<p><img src="/images/twitter.webp" alt="Twitter slinged" class="align-left" /> 
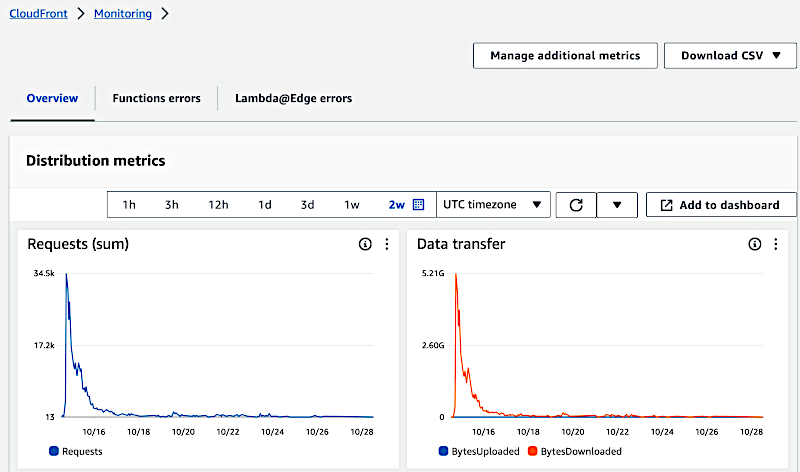
You might have noticed, if you’re brave enough these days to browse without an ad blocker, that I don’t run any ads. While I’m not aiming for profit, I do mention books I’ve personally read; I wouldn’t recommend them otherwise. Thanks to a recent post, I might’ve earned enough for a new book. Yet, I found it surprising how few readers reached out on <a href="https://www.linkedin.com/in/dzidas/">LinkedIn</a> to connect. In the past, I expected some readers to follow me on <a href="https://twitter.com/dzidorius">Twitter</a>, but I believe, sadly, that Twitter is dead. Interestingly, I received a lot of LinkedIn requests when someone shared my post to their connections. With RSS feeds slaughtered ages ago (thanks, Google) and Twitter slung recently, I don’t see a way for independent bloggers to build a persistent audience. Now, every post seems to be a hit or miss on news aggregators.</p>]]></content><author><name>Dzidas Martinaitis</name><email>blog@dzidas.com</email></author><category term="cloud" /><summary type="html"><![CDATA[]]></summary></entry><entry><title type="html">Causal inference as a blind spot of data scientists</title><link href="http://localhost:4000/ml/2023/10/15/blind-spot-ds/" rel="alternate" type="text/html" title="Causal inference as a blind spot of data scientists" /><published>2023-10-15T00:00:00+02:00</published><updated>2023-10-15T00:00:00+02:00</updated><id>http://localhost:4000/ml/2023/10/15/blind-spot-ds</id><content type="html" xml:base="http://localhost:4000/ml/2023/10/15/blind-spot-ds/"><![CDATA[<p>Throughout much of the 20th century, frequentist statistics dominated the field of statistics and scientific research. Frequentist statistics primarily focus on the analysis of data in terms of probabilities and observed frequencies. Causal inference, on the other hand, involves making inferences about cause-and-effect relationships, which often goes beyond the scope of traditional frequentist statistical methods.</p>

<p>Causal inference has a long history, but it gained more prominent attention in the latter half of the 20th century. This increased interest was partly due to advancements in statistical methods and the development of causal inference frameworks. In the 1980s, the work of Judea Pearl on causal inference significantly contributed to the field which continued into the 21st century. Economists and social scientists were among the first to recognize the advantages of these emerging causal inference techniques and incorporated in their research.</p>

<p>However, based on my personal anecdote, the data science community didn’t truly prioritize causal inference until around 2015 or later. It was during this period that less technically oriented economists faced significant challenges related to the scaling of big data, prompting them to seek assistance from data scientists. Unfortunately, data scientists often lacked the necessary expertise in causal inference, resulting in limited knowledge transfer to business stakeholders. As a result, we, the data scientists, missed an important development for quite a bit, so let’s catch up on that!</p>

<h3 id="what-is-causal-inference">What is causal inference?</h3>

<p><img src="/images/ny.webp" alt="New York in the parallel worlds" />
<em>New York in the parallel worlds</em></p>

<p>To explain causal inference, I like an analogy of a parallel or alternative world. Nowadays, with the help of GenerativeAI, we can really simulate or create new worlds. Have you ever wondered how New York would be if the Aztecs would take over of Americas? Or what if the Roman Empire still ruled the world?</p>

<p>Now, how does this relate to data science and business decisions? Well, businesses make important choices every day, like where to invest money, who to hire or fire, and what the consequences of public policies might be. The data they collect only shows one side of reality. To really understand the results of their decisions, they need to explore an unseen or simulated reality. That’s where causal inference comes in, helping us make better decisions by considering alternative outcomes.</p>

<p>Let’s take an example to make it clear. Imagine you’re in charge of expanding the business of a company that makes snack bars for kids. Your  goal is to boost sales, and you’re considering adding more sugar to your products because you have a hunch that kids love sugar. After enchancing all your snacks with sugar, you want to measure its impact. You want to know how much your sales would be in a parallel world where kids were stuck with bland snacks compared to your sweet treats. This is where causal inference steps in to provide the solution.</p>

<p><img src="/images/sweet.webp" alt="" />
<em>Sales of sweet snacks vs bland snacks</em></p>

<p>The chart above illustrates the difference between an observed scenario represented by the red line and an unobserved scenario represented by the black line. The technical term for the black line is ‘counterfactual’—it represents what the sales would be if we didn’t enhance the snacks with sugar.</p>

<p>To continue this intriguing story, let’s fast forward a bit. Now, you’re the CEO of the same company, which has gained international recognition and is traded on stock markets worldwide. However, recently, some pesky Facebook groups formed by moms and dads have launched a public campaign, claiming that your products and the entire concept behind them are making their children overweight and prone to diabetes.</p>

<p>In an effort to address these concerns and launch a PR campaign, you reach out to a university with whom you’ve collaborated in the past to improve your products. You ask them to investigate these claims. To your surprise, they request the same sales data that initially sparked the sugary product campaign. A few nights later, an underpaid PhD student conducts a causal inference analysis, constructs counterfactuals and uncovers the following findings.</p>

<p><img src="/images/diabetes.webp" alt="" />
<em>Percentage of people with diabetes, simulated data</em></p>

<p>Upon seeing these results, you become convinced that there is a conspiracy against you and your company. You quickly instruct your lawyers to halt any further funding to the university and come up with a plan to take legal action against all parties threatening you. From this intriguing tale, we can take two valuable lessons about how Causal Inference played a pivotal role in two critical business scenarios:</p>

<ul>
  <li>Assesing the impact on sales by adding more sugar to your products.</li>
  <li>Assessing the effects of a sugary diet on children’s health.</li>
</ul>

<p>Here are more examples of causal inference:</p>

<ul>
  <li>Effect of attending a data science meetup on a person’s future and earnings</li>
  <li>Air quality and free public transport</li>
  <li>Percentage of electric vehicles and air quality</li>
  <li>Impact of your campaigns (sales, marketing or support) on the revenue, profit, employees satisfaction and etc.</li>
  <li>A product or service price change on the demand</li>
</ul>

<h3 id="running-a-causal-inference-analysis">Running a causal inference analysis</h3>

<p><img src="/images/umbrellas_sun_small.webp" alt="" class="align-left" />
Looking back at our fictional story, the lawyers could raise a valid argument that association or correlation doesn’t necessarily imply causation. In simpler terms, just because there’s a correlation between high sugar consumption and an increase in the number of people with diabetes doesn’t mean that one directly causes the other. It’s another case of a spurious correlation, isn’t it? Take, for example, the high correlation between umbrellas and wet streets. Does that imply that people with umbrellas cause puddles on the streets? Of course not. It’s more likely that a common factor, in this case, a rain (or, using the technical term, a confounder), affects both variables. Now, the question is how can we estimate the impact given that there is a causal link between diabetes and a sugary diet?</p>

<p>One approach to understanding the impact of sugary snack consumption on diabetes risk would involve conducting an experiment. In this experiment, children would be randomly assigned to receive either unsweetened or sugary snacks. After a decade, we’d analyze how many children developed diabetes in each group and calculate any observed differences. If differences exist, we could confidently attribute them to causation since the random assignment eliminates biases. However, I can already see parents rolling their eyes and rightly questioning my moral values. And they’re correct - we can’t conduct cruel experiments on children or people. Secondly, it would take 10 years to figure out the difference, and thirdly, there are other biases to consider. Last but not least, it would be really expensive.</p>

<h3 id="linear-regression">Linear regression</h3>

<p>Let’s set aside for the moment the need to estimate <strong>causal</strong> impact and explore modeling the problem using linear regression. If we represent snack consumption as a binary variable (sugary or not), we can proceed as follows:</p>

<div class="align-center">\[diabetes_{i} = \alpha_0 + \beta * sugar_i + \varepsilon_i\]
</div>

<p>Now, here comes the exciting part – we can enhance our model by incorporating all the additional variables available to us. In our example, we might have access to demographic data, an individual’s activity or behavioral information. For instance, we can consider factors like how frequently and for how many hours a person exercises each week, their dietary habits, and so on.</p>

<div class="align-center">\[diabetes_{i} = \alpha_0 + \beta_s * sugar_i + \beta_r * race_i + \beta_g * gender_i + \beta_x * X_i + \varepsilon_i\]
</div>

<p><em>\(X_i\) denotes extra variables what we might include</em></p>

<p>You might be wondering whether adding more variables to the model is a good idea, and the short answer is: it depends. When dealing with a causal question, it’s crucial to include variables known as confounders. These are variables that can influence both the treatment and the outcome. By including confounding variables, we can better isolate and estimate the true causal effect of the treatment. Failing to add or account for confounding variables may lead to incorrect estimates.</p>

<p><img src="/images/confounder.webp" alt="" class="align-center" />
<em>Example of a confounder</em></p>

<p>Additionally, including variables that are only predictors of the outcome can be beneficial. It reduces the variance and allows for a more precise estimation of the causal effect. However, adding a variable that predicts only the treatment can lead to a less accurate estimation of causal effect. This occurs because it increases the variance, making it more challenging to estimate the causal effect accurately.</p>

<p>It is worth to emphasize, that a regression model gives an average estimate based on the given inputs. In causal inference, this outcome is referred to as the <strong>average treatment effect</strong>, \(ATE\), which provides an estimation across the entire group, rather than on an individual basis. Depending on the problem at hand, you might need to estimate an individual treatment effect. The Synthetic Control method, discussed below, allows you to assess the impact at an individual level.</p>

<h3 id="causal-graphical-models">Causal graphical models</h3>

<p>Now that we’ve discussed the cases to consider, let’s dive into the process of deciding which variables to include and which to omit in your model. Causal graphical models, championed by Jude Pearl since the 1980s, offer an appealing approach at first glance. The fundamental concept is to construct a Directed Acyclic Graph (DAG) that contains all variables in your analysis. Using this graphical representation  you can make informed decisions about which variables to retain and which to exclude.</p>

<p>In this framework, each node in the graph represents a variable, and an arrow pointing to another node signifies a causal relationship. The process of constructing this graph involves utilizing three building blocks: a pipe, a fork, and a collider, which help describe the causal flow between variables. This approach forces you to engage in a thoughtful and clarifying exploration of your model’s causal structure.</p>

<p><img src="/images/components_small.webp" alt="" class="align-center" />
<em>From left to right: a pipe, a fork and a collider</em></p>

<p>While learning about causal graphs can be challenging, it offers substantial benefits in understanding and addressing various causal inference problems and their solutions. Some argue that this approach doesn’t scale well on a model with +20 input variables. In my experience, most of the time we start with a limited set of variables and build the derivatives of these variables. Therefore, there is an opportunity to build a structural map on the primary variables in most of the cases.</p>

<p>Additionally, to alleviate the pain and speedup process, frameworks such as DoWhy and econml have been developed. In summary, starting your modeling journey with a causal graph may indeed be a challenging task, however it is a proven framework to get a robust and insightful model.</p>

<h3 id="instrumental-variable">Instrumental Variable</h3>

<p><img src="/images/instrument_small.webp" alt="" class="align-left" />
In a nutshell, the causal graph should facilitate a solution of a causal problem. However, there many methods to tackle the problem depending what data and challenge you have at hands. Instrumental Variable (IV) method is quite unique. In theory, it seems like a magical solution — you find a variable that has a causal link to a treatment, but doesn’t impact the outcome directly, and voilà, you’ve cracked the code of causation. However, there’s a crucial requirement: the IV must remain completely unrelated to any unobservable factors. This means you need prior knowledge ensuring that the treatment and the outcome have no connections with any variables — an undertaking that can be quite challenging, if not nearly impossible, in the real world. In my experience, I haven’t come across any instances of its use, but interestingly, nearly every causal inference course dedicates a chapter to this intriguing concept.</p>

<h3 id="difference-in-differences">Difference in Differences</h3>

<p>DiD is a straightforward method that can be implemented in Excel without the need for advanced tools. The concept revolves around comparing two versions of a subject or a unit under investigation: one before a particular event or treatment and the other after. To enhance the analysis, you introduce a control group — a similar entity that remains unaffected by the treatment.</p>

<p><img src="/images/diff-diffs.webp" alt="" />
<em>What are the potential effects of a young girl taking her chemistry classes seriously</em></p>

<p>Let’s consider an illustrative example: before the introduction of the free transport policy in San Diego, the average air pollution level was 10. After the policy was implemented, it decreased to 8. However, we can’t simply subtract 10 from 8, as it would yield biased results.
To address this issue, we turn to data from a neighboring city, Tijuana, located just across the border. In Tijuana, the pollution level before the policy was 11, and after its introduction, it dropped to 10. Notably, Tijuana was not affected by the policy. Applying this approach, we find that the bias reduction diminishes the impact from \(-2\) to \(-1\).</p>

\[diff = (SanDiego_{after} - SanDiego_{before}) - (Tijuana_{after} - Tijuana_{before}) =\]

\[(8 - 10) - (10 - 11) = -1\]

<h3 id="synthetic-control">Synthetic control</h3>

<p>In our previous example, we made an assumption that the cities were similar, with the treatment being the only differing factor. Furthermore, we simplified the problem by considering only four parameters, which inevitably introduced a degree of uncertainty into our estimation. But what if we had access to a wealth of data from various units (cities in the previous example) and the ability to observe changes over time?</p>

<p><img src="/images/Zuckerberg_twin_small.webp" alt="" class="align-left" /></p>

<p>Enter the word of Synthetic Control. Like a magician, we build a synthetic twin for our treatment group. To do that, we take the treatment group and regress against a bunch of similar units, and with regularization, we select the most relevant features and determine their weights.</p>

<p>For instance, let’s evaluate the impact of Mark Zuckerberg having children on teenagers’ happiness in social networks. In order to construct a synthetic control group, we certainly include Bezos, Musk, and Gates, but we might also add Jon from the UK and Guiseppe from France. Never heard of the latter two? That’s precisely the point!
With this model, built from data preceding the event (Zuckerberg having children), we project the data into the future, thereby generating our imaginery future, namely counterfactuals, which gives us a way to measure the impact.</p>

<p><img src="/images/zucker_small.webp" alt="" />
<em>Fictitious example</em></p>

<p>Previously, we discussed the average treatment effect, a measure that helps us estimate the overall causal impact on a treatment group. Now, with the synthetic control method, it becomes possible to estimate an individual treatment effect (in this case, the effect of Zuckerberg having children), provided that we have a sufficient amount of data to create a synthetic control.</p>

<p>Now, lets magic fade and look at disadvangates of synthetic control. The method assumes that all potential confounding variables are measured and controlled for as with linear regression. The synthetic control method assumes that the pre-treatment data accurately represent the underlying data-generating process. And on top of that, you get the standard ML problems - overfitting, difficult to validate (but not impossible) just to name few.</p>

<h3 id="double-ml">Double ML</h3>

<p>Since the ’90s, when causal inference gained popularity, the data landscape has changed significantly. More often than not, we now find ourselves dealing with enormous amounts of data for a given problem, often without a clear understanding of how all the variables interconnect. In theory, DoubleML can be helpful in such cases.</p>

<p><img src="/images/doubleml.webp" alt="" class="align-center" /></p>

<p>The DoubleML method is founded on machine learning modeling and consists of two key steps. First, we build a model \(m(X)\) that predicts the treatment variable \(T\) based on the input variables \(X\). Then, we create a separate model \(g(X)\) that predicts the outcome variable \(Y\)
using the same set of input variables \(X\). Subsequently, we calculate <strong>the residuals</strong> from the former model and regress them against <strong>the residuals</strong> from the latter model. An important feature of this method is its flexibility in accommodating non-linear models, which allows us to capture non-linear relationships — a distinctive advantage of this approach.</p>

\[\tilde{T}_{sugar} = T_{sugar} - m(X)\]

\[\tilde{Y}_{outcome} = Y_{outcome} - g(X)\]

\[\tilde{Y}_{outcome} = \alpha_0 + \beta_t *\tilde{T}_{sugar}\]

<p>Consider using DoubleML when you have high-dimensional data (many features) or when the relationships between inputs and treatment/outcome are not linear. DoubleML is particularly useful when you need to estimate treatment effects that vary across different subgroups or individuals. However, it’s essential to remember that DoubleML cannot magically eliminate the influence of poorly considered confounding variables.</p>

<h3 id="useful-resources">Useful resources</h3>

<p>The purpose of this blog post was to introduce readers to the world of Causal Inference and inspire them to explore it further. I’m planning to follow up with a hands-on post using public data. Below, you can find a list of resources that I found helpful during my own journey of learning about Causal Inference.”</p>

<ul>
  <li>
    <p><a href="https://matheusfacure.github.io/python-causality-handbook/landing-page.html">Causal Inference for The Brave and True</a>. It’s freely available on the internet, hands-on focused, and presents easily understandable formulas.</p>
  </li>
  <li>
    <p><a href="https://www.aeaweb.org/webcasts/2020/mastering-mostly-harmless-econometrics-part-1">Mastering mostly harmless econometrics</a>. A very nice introduction to Causal Inference. (video)</p>
  </li>
  <li>
    <p><img src="/images/ci_python.webp" alt="" /><a href="https://amzn.to/3M2myOG">Causal Inference in Python: Applying Causal Inference in the Tech Industry</a></p>
  </li>
  <li>
    <p><img src="/images/why.webp" alt="" class="align-left" /> <a target="_blank" href="https://www.amazon.com/Book-Why-Science-Cause-Effect-ebook/dp/B075DCKP7V?&amp;_encoding=UTF8&amp;tag=quantitativ0e-20&amp;linkCode=ur2&amp;linkId=2e09720775e30ccd7e76b53f970711c9&amp;camp=1789&amp;creative=9325">The Book of Why</a> by Judea Pearl,  the inventor of causal diagrams, not only delves deep into the theory but also offers valuable insights from a historical perspective.</p>
  </li>
</ul>]]></content><author><name>Dzidas Martinaitis</name><email>blog@dzidas.com</email></author><category term="ml" /><summary type="html"><![CDATA[Throughout much of the 20th century, frequentist statistics dominated the field of statistics and scientific research. Frequentist statistics primarily focus on the analysis of data in terms of probabilities and observed frequencies. Causal inference, on the other hand, involves making inferences about cause-and-effect relationships, which often goes beyond the scope of traditional frequentist statistical methods.]]></summary></entry><entry><title type="html">Challenges and ideas for charging an EV in Europe</title><link href="http://localhost:4000/greentech/2023/09/15/europe_charging_stations/" rel="alternate" type="text/html" title="Challenges and ideas for charging an EV in Europe" /><published>2023-09-15T00:00:00+02:00</published><updated>2023-09-15T00:00:00+02:00</updated><id>http://localhost:4000/greentech/2023/09/15/europe_charging_stations</id><content type="html" xml:base="http://localhost:4000/greentech/2023/09/15/europe_charging_stations/"><![CDATA[<p><img src="/images/parking_view.webp" alt="A charging station in Germany!" />
<em>A view from a Tesla charging station in Germany</em></p>

<p>The photo above captures the state of charging stations in <strong>Germany</strong>, and let me explain why I believe it does so. During a recent journey, I had the opportunity to travel across Germany, Poland, Lithuania, and back using an electric vehicle. While it wasn’t my first long trip with an EV, I noticed a difference when heading north as opposed to south of Europe.</p>

<p>In countries like France, Italy, Switzerland, Belgium, Luxembourg, and the Netherlands, most electric superchargers are situated outside of gas stations, often integrated with hotels or shopping malls. This setup provides less crowded, clean from litter areas, complete with  amenities and eating options.</p>

<p>However, in Germany, known for its pragmatic approach, charging stations are typically integrated into existing infrastructure not primarily designed for electric cars or tourists. Yet, I believe they are missing out on a significant opportunity by opting for the default or cheapest option. Electric cars are clean and exceptionally quiet, making them an attractive choice as customers. Any business can benefit from incorporating a charging station and attracting additional, and in some cases, well-off clientele.</p>

<p>In the past, there have been instances where companies tried to upsell customers who used a Mac computer to access their websites. With electric charging stations, there’s no need for engaging in dubious marketing schemes; you simply build one and gain access to a stream of potential customers. Some might argue that a short detour may be necessary to reach such places, but based on my observations, Tesla and other EV drivers are more than willing to make that small effort.</p>

<p>Tesla changing stations in <strong>Poland</strong> are located away from traditional gas stations. However, it’s worth noting that the network’s coverage is quite sparse, with a station typically available only every 300 kilometers. This leaves little room for error and can be challenging for long-distance travelers. While there are alternative superchargers available, the lack of competition in Poland, and similarly in Germany, has resulted in high pricing, often double what Tesla charges. So, there’s a business opportunity here: open a charging station that offers a competitive pricing!</p>

<p>The situation in <strong>Lithuania</strong> is quite chaotic. It appears that the government is attempting to promote electric vehicles (EVs) by offering free charging stations, but charging time limited to 15 minutes or 1 hour. This complicates matters further as some stations are either broken or consistently occupied, making it a challenge for travelers passing through to find an available spot. This situation results in unrealistic expectations, particularly when potential EV buyers compare the expenses to those of a 20-year-old diesel car. Additionally, a few superchargers in the country charge extremely high prices. Interestingly, there’s a silver lining as a single Tesla station in the country offers free charging. As a first step, I strongly recommend abandoning the concept of free charging stations and instead focusing on building a reliable and efficient EV charging infrastructure.</p>

<p>And lastly, the most annoying thing which is common across different countries, is the need to install separate apps and register on various websites for non-Tesla charging stations. As a consumer, I want a “tap to pay” or a single app solution to manage all my charging needs. A business opportunity, right?</p>]]></content><author><name>Dzidas Martinaitis</name><email>blog@dzidas.com</email></author><category term="greentech" /><summary type="html"><![CDATA[A view from a Tesla charging station in Germany]]></summary></entry><entry><title type="html">Navigating the Future of AI: Strategies for Survival</title><link href="http://localhost:4000/ml/2023/03/19/chatgtp-eats-the-world/" rel="alternate" type="text/html" title="Navigating the Future of AI: Strategies for Survival" /><published>2023-03-19T00:00:00+01:00</published><updated>2023-03-19T00:00:00+01:00</updated><id>http://localhost:4000/ml/2023/03/19/chatgtp-eats-the-world</id><content type="html" xml:base="http://localhost:4000/ml/2023/03/19/chatgtp-eats-the-world/"><![CDATA[<p>Lately, reading the news and following updates about advancements in AI, specifically in Generative AI and chatGPT, gave me mixed feelings - on one hand, we are on something big and impactful, but at the same time it feels like a potential threat to the future. And I’m not alone - NLP students lost their field of research overnight, meanwhile <a href="https://old.reddit.com/r/MachineLearning/comments/11rizyb/d_anyone_else_witnessing_a_panic_inside_nlp_orgs/" target="_blank">some orgs at FAANG</a> became obsolete. It is an old news that chatGPT can pass a software developer tests at FAANG, an exam to become a lawyer or generate inspirational phrases for your <a href="https://youtu.be/TBZM7ZQsCQU" target="_blank">YouTube shorts</a>. But I’m sceptical that we will experience a radical transformation in a short time of a few years, but rather, it will be an iterative change which can take a decade or more. But as a story goes, a slowly boiled frog was too comfortable to jump out of a pot, the fate we shall avoid.</p>

<p>My scepticism grew since 2010, when we were promised self driven cars, tomorrow! Looking back, it felt then, that we just needed a bit, maybe a year or two, and Uber or Bolt will be driverless. Do you see it coming next year, two years? I’m less optimistic this time, giving it another decade or so. And more recently, with the birth of Stable Diffusion back in 2022, it felt like we are going to generate movies for ourselves, find business ideas based on recent trends or build product promotions from a single photo. Where are we today? Well, we can generate “artistic” content with limited applicability in the business context, at best. Sure, startups are burning midnight oil to come up with innovative products, but so far it didn’t change much.</p>

<p>In the defense of chatGPT or LLMs, I agree that it already has a impact - as <a href="https://github.com/features/copilot" target="_blank">a coding assistant</a>, a translator, an initial knowledge bank or a sentence generator, but we still neeed that connector between the keyboard and the chair. But don’t forget that you already taxed with useless content what is generated in a bink of the eye, meanwhile AI wars are yesterday’s news. Marketing companies are heavily rely on auto-generated text as in the example with YouTube shorts, meanwhile social platforms deploy AI to recognise and ban such content, so the former parties now use another service to paraphase the auto-generated content.</p>

<p>Let me offer you a different angle against this doomsday outlook. Few years back, as a part of Amazon Cloud(AWS) organization, I worked with AWS customers to transform their businesses by employing machine learning solutions. My main take away from that experiece was that the business doesn’t care about lastest state of the art ML/Ai technique unless it gives a competive advantage. As a consequence, they are happily running a 20 years logistic regression model or a rule based system, which they call ML model to please shareholders or investors. 
As a personal anecdote, I was leading a team of engineers with the goal build a deep learning model for a computer vision problem. After 3 weeks of development, it became obvious, that the approach, favored by the sales team, gives 80% accuracy at best, meanwhile the customer was insisting on a human, 100% accuracy. So, we gave ourself a chance to look beyond a deep learning approach and sure enough, within few days we found a solution based on <a href="https://opencv.org/" target="_blank">an old computer vision library</a>. In the end, it was a rule based approach which ~20 lines of code and was 100% accurate. To put more salt on the AI wound, the cost of running it in a serverless enviroment was $3 versus $70K for a deep learning solution and no maintenaince at all. What a beauty, right?</p>

<p>So, my dear reader, how we will survive the future ruled by cruel and fearless AI? I would emphasize two things: by putting business ideas and challenges upfront as in the example above or <a href="https://twitter.com/ID_AA_Carmack/status/1637087219591659520" target="_blank">in this short tweet</a> by former CTO Oculus VR; and diversifying our skills. If today’s trend is any good for future prediction, then majority of AI innovations of today will be in hands of handful and we will be hapilly consuming them as cloud services. Meanwhile, we will be instrumental for the business to bridge the gap, therefore our skills need to be diversified, nevertheless adjacent. Below, you can find a suggestive list of actions to diversify the skills. Let me know if have a suggestion in the comments of a social platform or on <a href="https://twitter.com/dzidorius" target="_blank">Twitter</a>.</p>

<ul>
  <li>If you are a AI/ML practitioner, embrace yourself and look beyond your field. For me, it was Bayesian statistics and causal inference. As with all religions, there is <a href="https://www.amazon.com/Statistical-Rethinking-Bayesian-Examples-Chapman/dp/036713991X?crid=2E6UIQV6V5LK8&amp;keywords=Statistical+Rethinking&amp;qid=1679240800&amp;s=books&amp;sprefix=statistical+rethinking%2Cstripbooks-intl-ship%2C162&amp;sr=1-1&amp;linkCode=ll1&amp;tag=quantitativ0e-20&amp;linkId=49ace44496b8b6342a6626901bbe2a14&amp;language=en_US&amp;ref_=as_li_ss_tl" target="_blank">one Bible</a>, which all followers must get acquainted. And to strenghted your belief, <a href="https://www.youtube.com/playlist?list=PLDcUM9US4XdMROZ57-OIRtIK0aOynbgZN" target="_blank">a very good YouTube course</a> is provided as well.</li>
  <li>If you are in an IT related field, the cloud knowledge is a must nowadays. <a href="https://acloudguru.com" target="_blank">ACloud.guru</a> really helped me to learn about Amazon, Google and Azure clouds and pass a couple of certificates.</li>
  <li>Don’t skip over Data Engineering which is tightly coupled with ML Operations. For the former, I would suggest <a href="https://www.amazon.com/Fundamentals-Data-Engineering-Joe-Reis-ebook/dp/B0B4VH4T37?_encoding=UTF8&amp;qid=1679330656&amp;sr=1-1&amp;linkCode=ll1&amp;tag=quantitativ0e-20&amp;linkId=9323b2b7cb1ede6ab419ca340033f382&amp;language=en_US&amp;ref_=as_li_ss_tl" target="_blank">“Fundamentals of Data Engineering”</a> and for the latter - <a href="https://www.amazon.com/Designing-Machine-Learning-Systems-Production-Ready/dp/1098107969?crid=2G2L23MXMDIRX&amp;keywords=Designing+Machine+Learning+Systems&amp;qid=1679330730&amp;s=books&amp;sprefix=designing+machine+learning+systems%2Cstripbooks-intl-ship%2C309&amp;sr=1-1&amp;linkCode=ll1&amp;tag=quantitativ0e-20&amp;linkId=0fecd993bed86f87a7325e6474918147&amp;language=en_US&amp;ref_=as_li_ss_tl" target="_blank">“Designing Machine Learning Systems”</a>.</li>
  <li>Incorporate AI advancements in your life - Copilot, ChartGPT and etc. There is no shame of working smarter, but be conscious of potencial information leak. To my surprise, some schools in Europe are encouriging students to use ChatGPT for writing.</li>
  <li>Learn about internet marketing and keep eye on it in order to better understand your customers.</li>
</ul>]]></content><author><name>Dzidas Martinaitis</name><email>blog@dzidas.com</email></author><category term="ml" /><summary type="html"><![CDATA[Lately, reading the news and following updates about advancements in AI, specifically in Generative AI and chatGPT, gave me mixed feelings - on one hand, we are on something big and impactful, but at the same time it feels like a potential threat to the future. And I’m not alone - NLP students lost their field of research overnight, meanwhile some orgs at FAANG became obsolete. It is an old news that chatGPT can pass a software developer tests at FAANG, an exam to become a lawyer or generate inspirational phrases for your YouTube shorts. But I’m sceptical that we will experience a radical transformation in a short time of a few years, but rather, it will be an iterative change which can take a decade or more. But as a story goes, a slowly boiled frog was too comfortable to jump out of a pot, the fate we shall avoid.]]></summary></entry></feed>