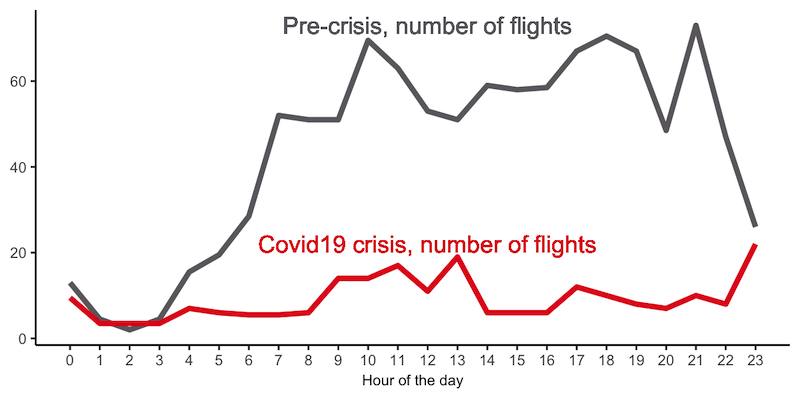
The majority of airports in Europe are shut down, so I was wondering what is going on in the air. The chart above shows the number of flights crossing, originated from or destined to a small European country, Luxembourg. The number of flights plummeted around 85%, but it is not big surprise to anyone as the crisis engulfed the world. So, today we have 15 flights per hour on average and it is important to repeat, that these are flights not only from or to Luxembourg airport, but fly over as well. The idea is to use it as an indicator of the global economy. Currenty, it took a huge hit and the airline industry is on the brink of bankruptcy. However, according to a recent news, air freight segment is flourishing. The way how data is collected allows us to figure out what the percentage of cargo planes is in the air and how is it changing over time by looking into an ICAO 6 digit hex code of each airplane. Below you can find the instructions how to build such data capture system, which is based on a software defined radio (SDR) device.

You can see my setup in the photo above. The main component here is NooElec NESDR usb stick and I use a Raspberry Pi computer to have an autonomous system, however you can run it on your PC. You can do many things with a SDR device - listen to the radio or watch TV, track the airplanes in your area, receive satelite weather images and etc. To begin with, you need to plug the device into your computer, tune to 1090 Mhz frequencyon any SDR application and start collecting data, however I recommend installing dump1090 software as it provides many things, e.g. decoding radio waves into digital representation. Below you can find a Linux bash script to launch the application and start dumping the data into a text file.
1. /home/your_path/dump1090/dump1090 --net --metric &
2. sleep 10
3. nc localhost 30003|sed -e "s/^/$(date +%s),/" >>/home/your_path/dump1090/dump_data.txt &
4. python /home/kafka/dump1090/planes_firehose.py &
On line 1, we are starting dump1090 application and passing some parameters, which might be relevant only to me, e.g. --metric. Line 2 gives some time to the application to start, otherwise the following line can fail. Then, on line 3 we use Linux netcat command to capture the incoming data on port 30003 and dump it to a text file. Now, if you just want to have a data dump on your local computer, then these first three lines are all you need. I went one step further and built a script to store the data on AWS S3 while streaming data to AWS Kinesis Firehose. Below you can find a Python script to store your data on AWS.
from datetime import datetime
import boto3

import socket
import datetime
import time


def netcat(hostname, port):
    kinesis = boto3.client('firehose')

    msg_list = []
    s = socket.socket(socket.AF_INET, socket.SOCK_STREAM)
    s.connect((hostname, port))
    #s.sendall(content)
    #s.shutdown(socket.SHUT_WR)
    while 1:
        try:
            data = s.recv(1024)
            if data == "":
                break
            #print(data.decode('utf-8'))
            data = data.decode('utf-8').split('\n')
            ts = str(int(time.time()))
            for d in data:
                if len(d)>0:
                    msg_list.append({'Data':bytes( ts + ', ' + d +'\n', 'utf-8')})
            #print(msg_list)
            if len(msg_list)>60:
                kinesis.put_record_batch(DeliveryStreamName="plane-fire", Records=msg_list)
                print(msg_list)
                msg_list = []
        except Exception as e:
            print("Connection error: "+str(e))
    print("Connection closed.")
    s.close()


netcat('127.0.0.1', 30003)
The cool part is that you can analyze and build insights direclty in the cloud. I use AWS Athena service to query csv files on AWS S3 and download just summarized data if needed. Here is an example how to run a query on the dataset collected with dump1090 application:
WITH glb as(
SELECT CAST(from_unixtime(CAST(ts AS bigint)) AT TIME ZONE 'Europe/Luxembourg' AS date) as day,
  date_format(from_unixtime(CAST(ts AS bigint)) AT TIME ZONE 'Europe/Luxembourg', '%H') as hour,
  ROW_NUMBER() over (partition by hex_code,
  	CAST(from_unixtime(CAST(ts AS bigint)) AT TIME ZONE 'Europe/Luxembourg' AS date),
	date_format(from_unixtime(CAST(ts AS bigint)) AT TIME ZONE 'Europe/Luxembourg', '%H')
  	 order by ts asc ) as row_nr,

* FROM "flights"."planes2020" WHERE SUBSTR(col1,2,4)='MSG' AND length(hex_code)=6
),
one_per_hour AS(
  select * from glb WHERE row_nr=1
  )
select day, hour, hex_code, count(*) from one_per_hour
GROUP BY day, hour, hex_code
Lastly, you might wonder how much does it costs to stream, store and analyze the data in the cloud. Currently, my expenses for this project is less than $0.01 and I expect it to be under $1 at the end of the month.